


Collecting Execution Trace for ARM Chips
In this blog, I’ll walk through the basics of execution tracing for ARM chips. I will mainly focus on methods based on ETM - a powerful hardware feature found in many ARM processors that enables non-intrusive, cycle-accurate tracing of instruction execution. Unlike breakpoints or printf-style debugging, ETM allows developers to observe exactly what code was executed without altering the timing or behavior of the program.
This blog only focuses on methods based on hardware features.
Table of Contents
Tracing Without ETM
Before introducing execution tracing based on ETM, I’d like to first introduce some alternatives.
Related Work: FrankenTrace
The paper FrankenTrace: Low-Cost, Cycle-Level, Widely Applicable Program Execution Tracing for ARM Cortex-M SoC introduces a method for collecting traces without relying on ETM.
FrankenTrace collects full cycle-level traces by repeatedly executing the target software with varied tracing configurations and then merging the results. This approach overcomes the bandwidth limitations of low-speed debug interfaces (like SWO) without needing expensive ETM-based hardware.
The difficulty in trace collection without using ETM can be illustrated by the following example from the paper: “As a point of reference, let us consider the Texas Instruments CC2650 SoC, deployed as an experimental node in the 1KT testbed. This SoC is clocked at 48 MHz and features two single-cycle memories. A tracing packet with a value of PC, as sampled by DWT, has a size of 5 B. A timestamp packet of ITM, in turn, has a size of 1–5 B. With the 6.4 Mbps of SWO throughput, tracing is inherently limited to about 100K samples per second. In effect, PC can be sampled approximately only once every 512 CPU cycles.”
Hardware features required:
- DWT (Debug Watchpoint and Trace): Configured to sample PC or monitor memory accesses.
- ITM (Instrumentation Trace Macrocell): Receives trace packets and timestamps them.
- SWO (Single Wire Output): Used to output trace data over UART (low bandwidth).
The trace can be collected with cheap logical analyzers or UART-USB chips.
FrankenTrace supports generating two types of traces: a noninvasive cycle-level PC trace and a cycle-level LSU trace of varying invasiveness.
Below is a screeshot from the paper, illustrating half of the workflow (I included only the workfow involving cycle-level PC trace).
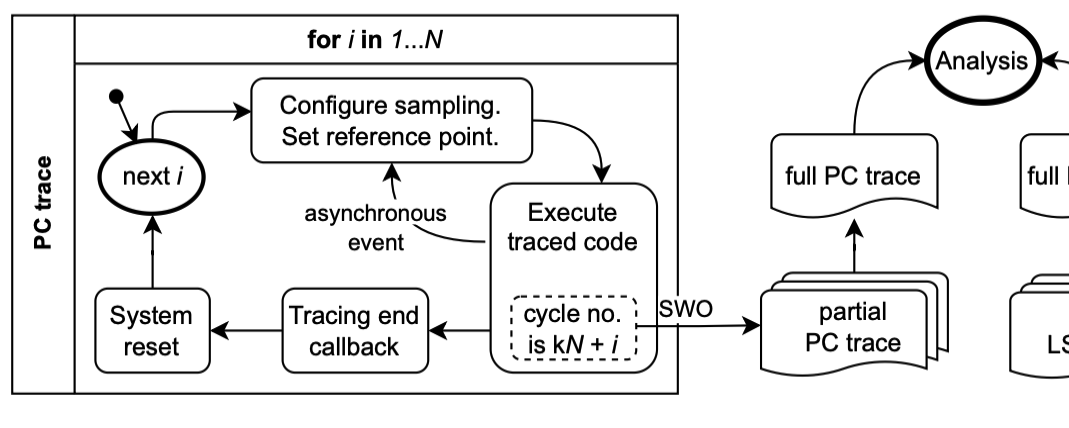 In the paper, the authors used DWT to sample PC at exactly N-cycle intervals, where the value of N is configurable. Since PC is sampled upon a transition of a configured tap bit of the cycle counter, to control the sampling offset for different i, the authors adjusted the point at which the sample is taken by “carefully manipulating the DWT configuration and by modifying the initial value of the counter”.
Despite the fact that FrankenTrace can collect execution traces at much lower cost and without requiring ETM, I personally find this method not entirely reliable. The instruction trace is reconstructed based on N independent executions (via system reset), and the nondeterminism in these executions is simply non-negligible. The authors also point out that, due to nondeterminism, it often takes more than N executions to obtain consistent and useful traces. To determine consistency, the authors insert a special piece of code with a known trace before the analyzed code and later use this to check for validity.
If the goal of collecting an execution trace is to obtain a precise reflection of the entire execution process, then trace collection based on re-execution seems somewhat unreliable to me.
That said, I can certainly imagine scenarios where FrankenTrace would be useful:
- When one wants to collect execution traces for an ARM chip without ETM support (this is somewhat common among Cortex-M3-based SoCs, a related table can be found in the paper).
- When one wants to reverse engineer some closed-source hardware by efficiently collecting its execution trace, without requiring strong consistency.
For the actual experiments, the authors employed a USB logic analyzer based on a popular Cypress CY7C68013A chip, which allows for reliable sampling at up to 24 MHz. For robust symbol recovery they sampled 3 times per symbol, achieving a maximum effective UART symbol rate of 8 Mbaud. The captured data was then processed in software by two decoders from the open-source sigrok project: first by a UART decoder and then by an ARM ITM decoder. They modified the latter to save the decoded tracing packets to a CSV that can be subsequently processed to generate the final trace.
Mbaud stands for Mega Baud, which means 1 million baud. It is a unit of symbol rate. Baud rate refers to the number of symbols transmitted per second. A symbol is a “unit” of communication that the receiver can distinguish from others. In binary communication (like UART): 1 symbol = 1 bit
Tracing with ETM
What is ETM?
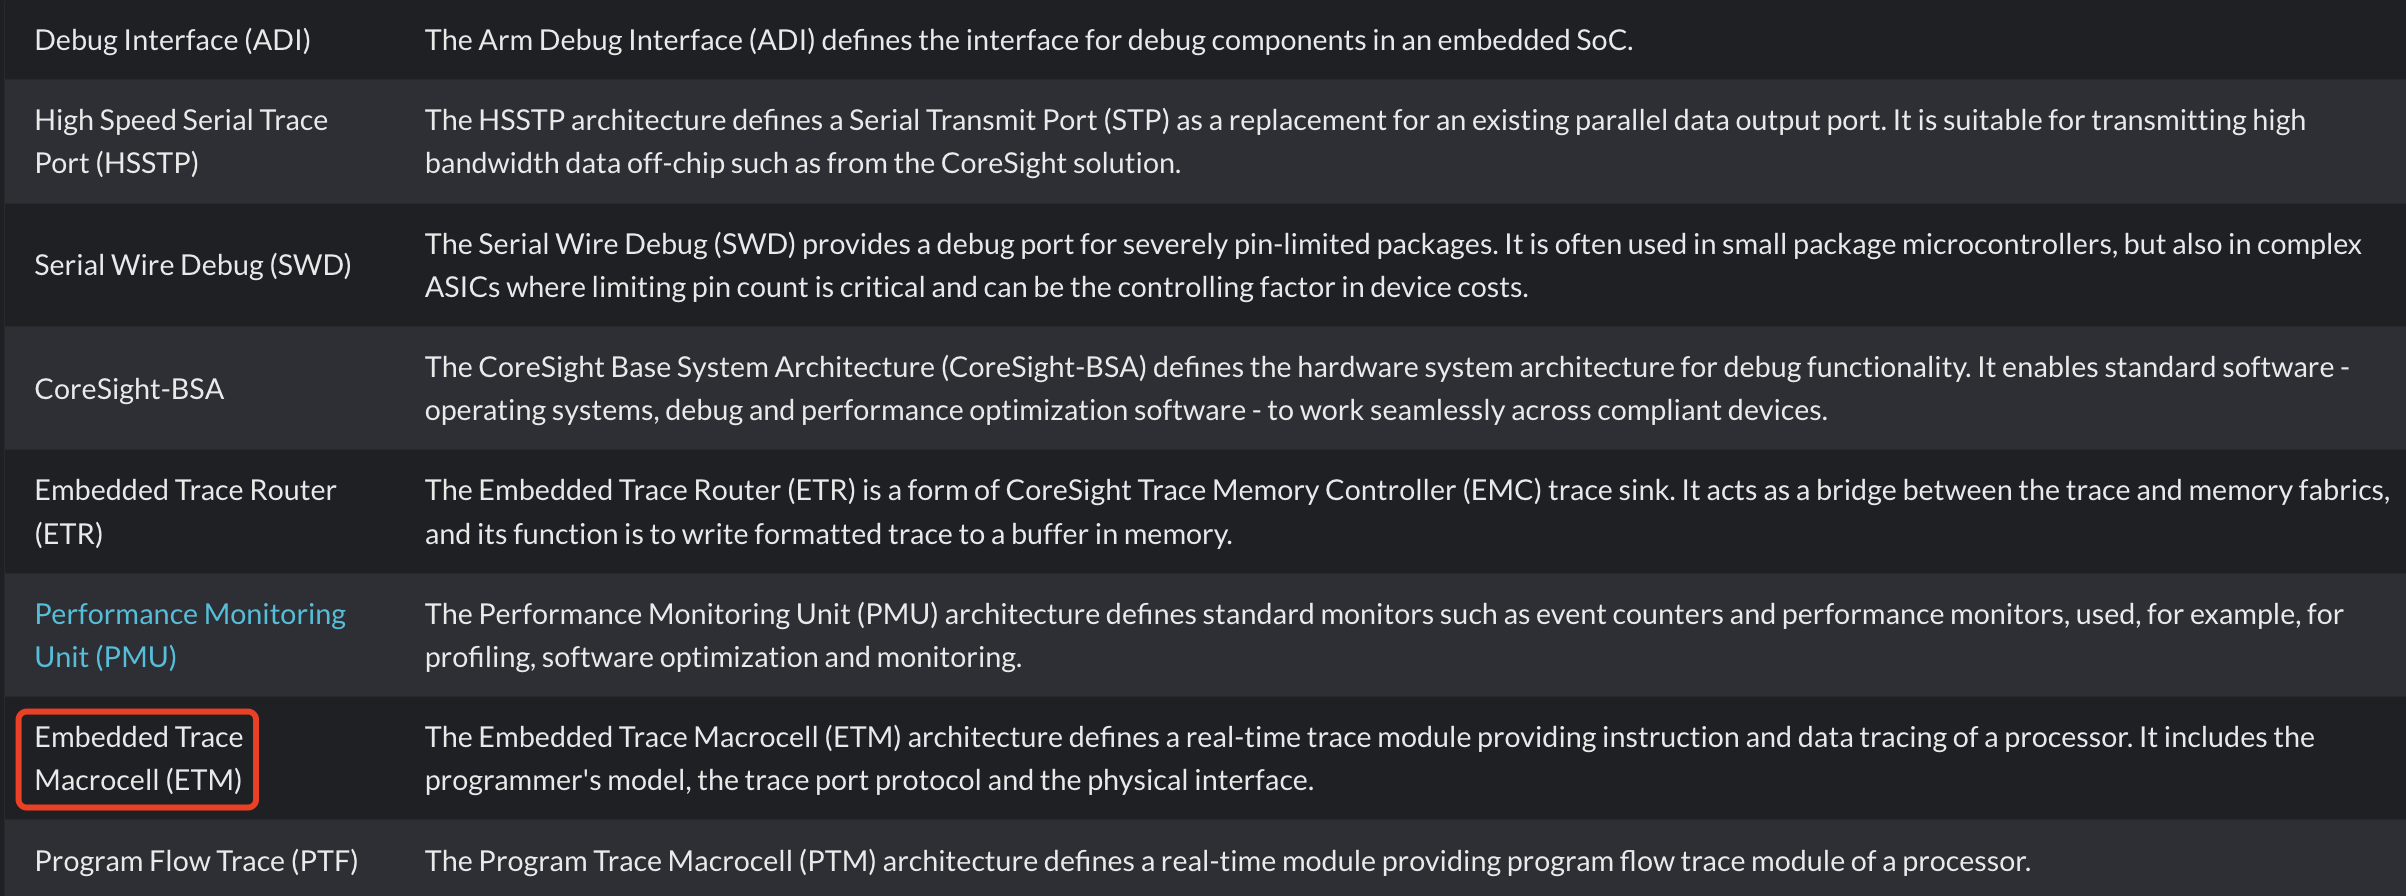
ETM stands for Embedded Trace Macrocell. It is a real-time trace module providing instruction and data tracing of a processor.
People like ETM since it provides non-intrusive, cycle-accurate, real-time tracing 🍺. However, it’s worth noting that not all ARM chips support ETM.
There is more than one webpage introducing ETM on the Arm website, two major ones are:
- Embedded Trace Macrocell Architecture Specification, 2011 (I will refer to it as ETM Arch Spec v3.5 from here on).
- Embedded Trace Macrocell Architecture Specification ETMv4.0 to ETM4.6, 2023 (I will refer to it as ETM Arch Spec v4.0 from here on).
In ETM Arch Spec v4.0 there is a section named Introduction to the ETMv4 architecture, where major changes in ETMv4 is listed. Below I list some critical ones:
- ETMv4 supports tracing 64-bit architectures, Armv8 architecture
- ETMv4 provides data tracing, event tracing, and tracing of conditional non-branch instructions in addition to instruction tracing
- ETMv4 places no requirements on the impact that trace generation has on the performance of a PE. For some markets and trace requirements, the trace solution might always have some performance impact on the PE and the ETMv4 architecture does not prohibit this.
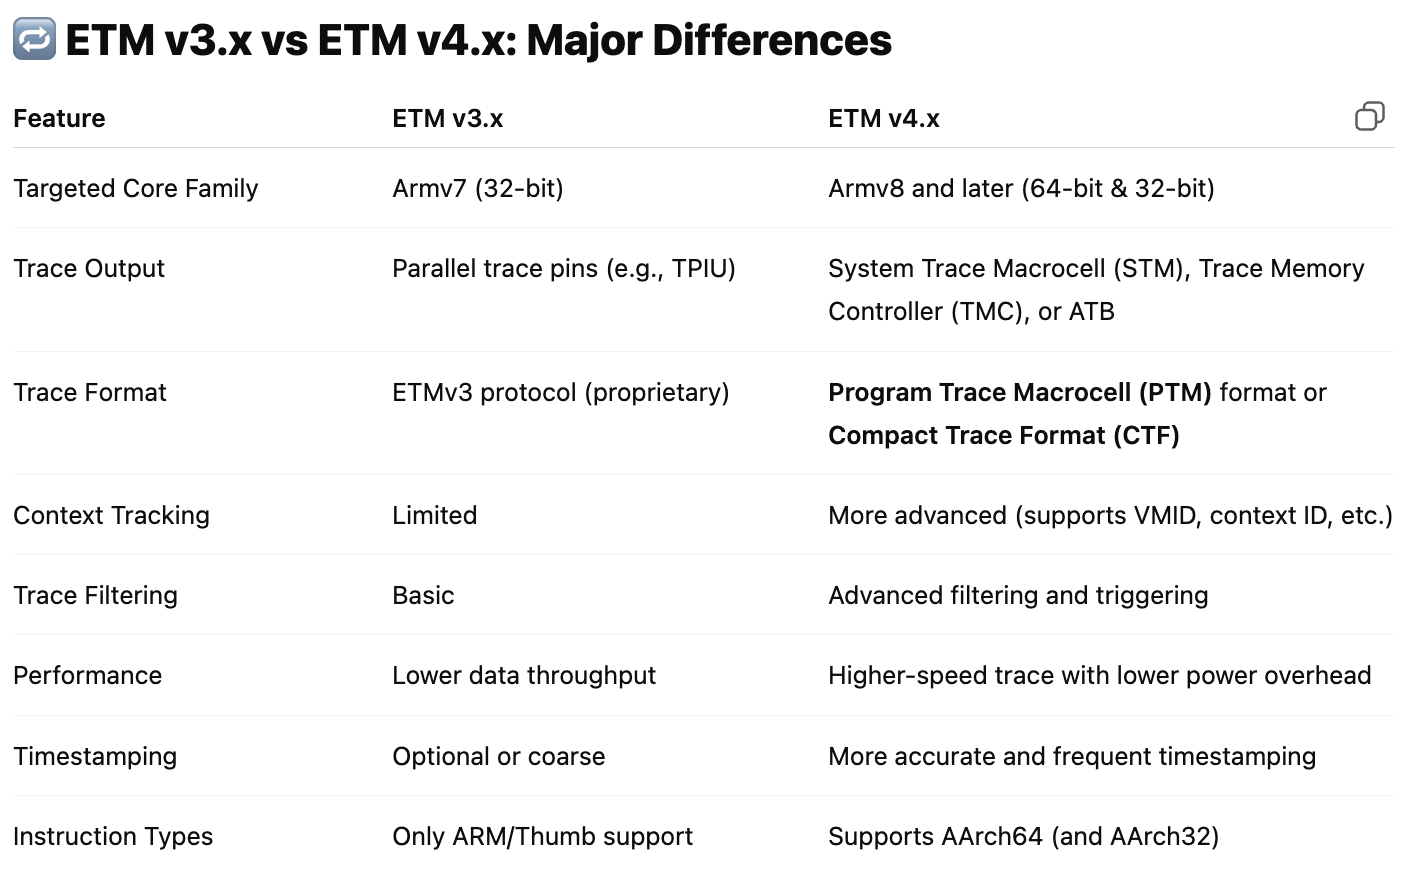
According to ChatGPT the major differences can be summarized as below,
Furthermore, regarding typical chip models that support ETM, ChatGPT generated the following summary.
ETM v3.5 is used mostly in Armv7-A and Armv7-R cores:
Cortex-A5, Cortex-A7, Cortex-A8,
Cortex-A9, Cortex-A15, Cortex-R4/R5
Cortex-M series don't use ETM v3.5
    but may use ETM-M (a scaled-down version)
ETMv4.0+ is used in Armv8-A (64-bit) and newer high-performance cores:
Cortex-A35, Cortex-A53, Cortex-A55
Cortex-A57, Cortex-A72, Cortex-A73
Cortex-A75 and newer
Neoverse series (E1, N1, V1)
In light of this, I will focus on ETM v4.0+ in this blog post. The pdf documentation for ETM Arch Spec v4.0 has 570 pages. In the content below, I aim to cherry-pick the parts that interest me and summarize what I’ve learned.
ETMv4
The subjects of tracing in ETMv4 includes:
- Instruction execution.
- Data movements.
- Events in a PE.
PE (Processing Element) is the abstract machine that is defined in the Arm architecture. It can be simply viewed as a single CPU core.
A trace unit performs the tracing functions. A trace unit might be implemented as part of a full debug solution inside a SoC. It has the following interfaces:
- A PE interface, providing visibility of instruction execution and data movements within a PE.
- One or more programming interfaces:
- A system instruction interface for direct programming from a PE.
- A memory-mapped interface for programming from a PE or other Managers in the system.
- An external debugger interface which is connected to a debug port on the chip, such as an ADI Debug Access Port (DAP).
- A trace output interface, such as a parallel data interface. There are three ways to export the trace:
- Use a dedicated trace port capable of sustaining the bandwidth of the trace to realize real-time continous export.
- Use a dedicated memory (called Embedded Trace Buffer, aka ETB in the CoreSight technology) to store short-term trace in a circular buffer style, and later export with debug port like JTAG-DP.
- Use a range of reserved shared system memory. Note that this means tracing might affect system behavior, because the trace contends for system bus bandwidth with normal bus traffic (unlike ETB, which has its own bus).
Below is an example of trace unit that is implemented in an SoC.
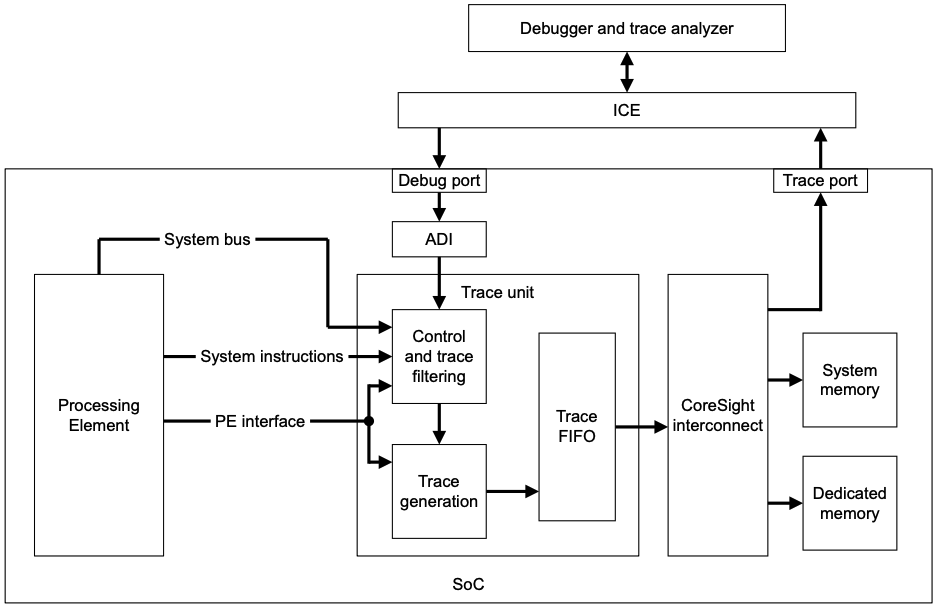
- ADI: Arm Debug Interface.
- ICE: In-Circuit Emulator.
Since the trace collected during execution can quickly take up a huge storage, a few compression techinques is used when generating the trace stream. The main technique her is the concept of P0 elements in the instruction trace stream. A P0 element acts as a signpost in the program flow, indicating that execution is proceeding along a given branch. A trace analyzer can reconstruct the stream of instructions that are executed between P0 elements by using the P0 element stream and the program image. To further compress or generate more details, there are configurations such as: 1. removing program addresses from the trace; 2. including a return stack.
Additionally, there are many ways to configure the trace being collected, some noticeable approaches are:
- Filtering of trace (for only functions/data transfers/code of interest)
- Trace unit resources (e.g. counters, comparators, and external inputs) can be used
- Specify which types of instructions are traced
It’s worth noting that in ETM Arch Spec v4.0 there is Appendix C Recommended Configurations section which contains a set of recommended configurations for trace unit implementations. Besides, Appendix D Filtering Examples and Appendix E Resource Selection Examples are useful references as well.
What is CoreSight?
CoreSight is another concept that comes closely with ETM. At a high level, ETM is a feature that captures trace data from a specific CPU core, and CoreSight is an infrastructure that collects trace data from sources like ETM, routes it through components (e.g., funnels, replicators), and outputs it to a trace sink (e.g., TPIU or memory).
The CoreSight architecture provides a set of standard interfaces and programmer model views. ETM is one of them.
Related Work: Ninja
Ninja leverages a hardware-assisted isolated execution environment Trust-Zone to transparently trace and debug a target application with the help of Performance Monitor Unit (PMU) and Embedded Trace Macrocell (ETM).
An overview of the Ninja architecture:
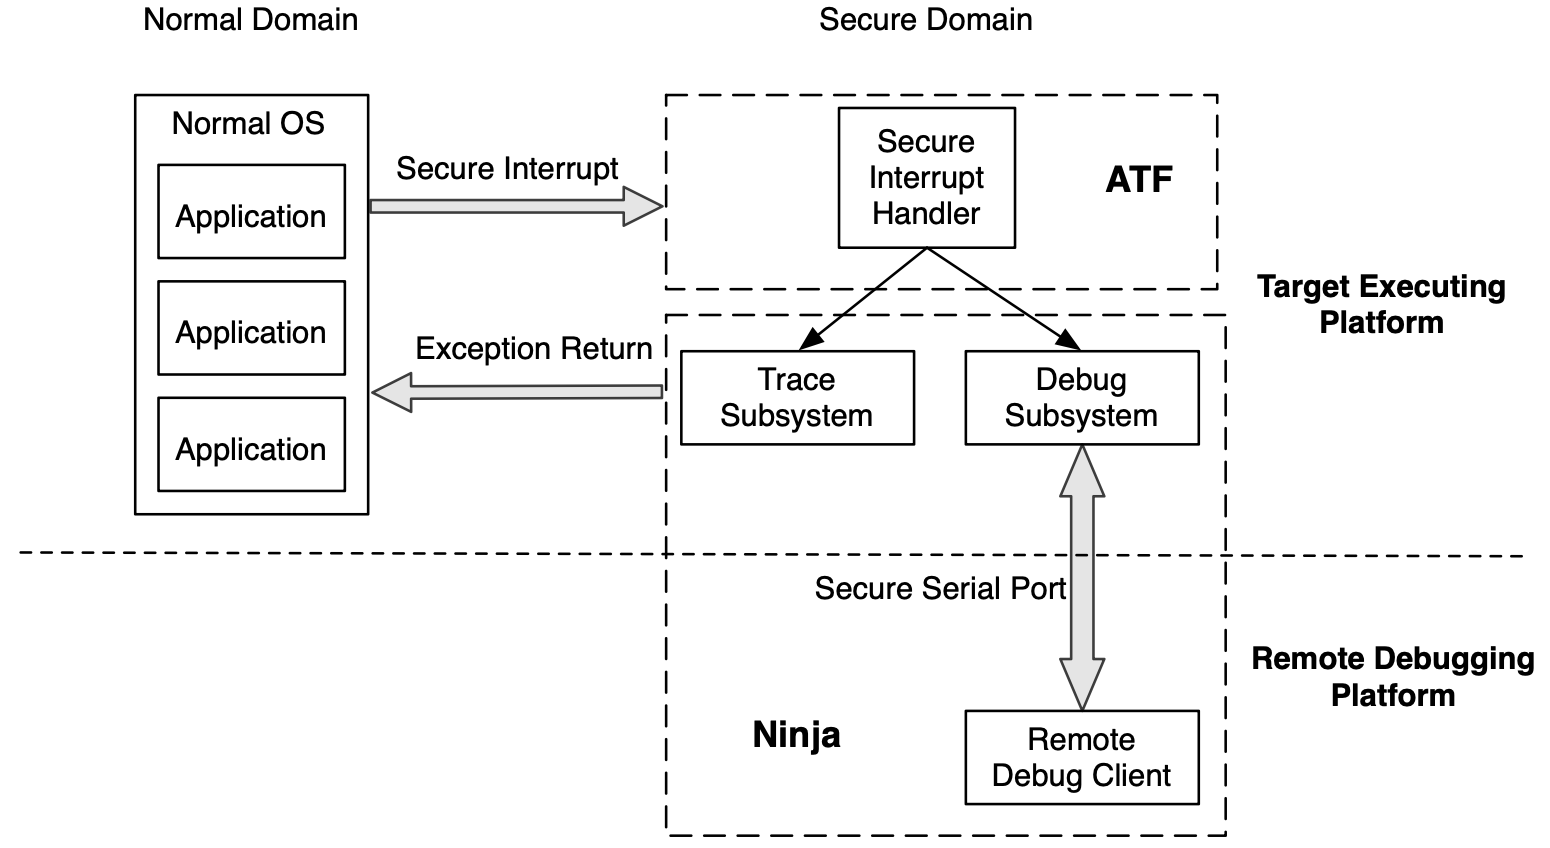
The main idea of this design is that the “normal OS” (Linux or Android) on the left is being executed in normal domain, and the Ninja system on the right is being ran in secure domain. Such isolation makes use of the hardware-based TrustZone feature provided by ARM.
The experiments were conducted on a 64-bit ARMv8 Juno r1 board, which has two ARM Cortex-A57 cores and four ARM Cortex-A53 cores.
As mentioned in Section 5.3.1, there are funnels controlled by a group of CoreSight Trace Funnel (CSTF) registers, the ETM trace is filtered by these funnels. For Ninja’s experiment, the authors only collected traces for the core 0 in the Cortex-A57 cluster. The filtered result is output to Embedded Trace FIFO (ETF) which is controlled by Trace Memory Controller (TMC) registers.
The ETM is controlled by a group of trace registers. The following setting is applied to the Ninja system:
- Set all
EXLEVEL_Sbits and clear allEXLEVEL_NSbits of theTRCVICTLRregister to collect trace for non-secure EL0 and non-secure EL1. - Set the
ENbit of theTRCPRGCTLRregister to start the instruction trace. - Clear the
ENbit of theTRCPRGCTLRregister to disable ETM. - Set the
StopOnFlbit and theFlushManbits ofFFCRregister in theTMCregisters to stop the ETF. - To read the trace, keep reading from the
RRD(RAM Read Data) register until0xFFFFFFFFis fetched.
The authors also mentioned in Section 5.3.2 how to trace system calls with ETM and PMU.
Experiments related to the tracing subsystem is introduced in Section 7.1. The authors wrote a simple Android application that uses Java Native Interface to read the /proc/self/status file line by line. The file contains 38 lines in total, it takes about 0.22 ms to finish executing. After the execution, the ETF contains 9.92 KB encoded trace data, and the datarate is approximately 44.03 MB/s. After decoding with ptm2human, the decoded data contains 1341 signpost instructions.
Signpost instructions are used to help tools or developers identify and interpret events in the trace or log data. Examples of what they mark: Beginning and end of critical sections; Context switches; Specific events like acquiring a lock or sending a message.
Related Work: 𝜇AFL
𝜇AFL proposes the first fuzzing tool that is applicable to the driver code of MCU (Micro Computing Unit) firmware, it leverages the tracing capability of ETM to collect execution trace for the fuzzer.
The experiments are performed on a NXP TWR-K64F120M (Cortex-M4 based) and a STM32H7B3I-EVAL (Cortex-M7 based). Persumably, the version of ETM used by the authors is ETMv3.5 or earlier.
J-Trace Pro is used in the experiments for three main purposes:
- Feed testcases to the target device (see Section 3.2 “We leverage the SEGGER RTT protocol for high-speed transmission”)
- Configure filters for ETM (in Section 3.3 “We use the DWT hardware feature to filter out irrelevant ETM packets”, DWT is likely to be controlled by the debug dongle)
- Collect the trace stream from ETM
Related Work: HATBED
HATBED from HATBED: A Distributed Hardware Assisted Testbed for Non-invasive Profiling of IoT Devices is a testbed designed for IoT devices equipped with ARM Cortex-M3/M4 processors, utilizing standardized built-in debugging units and general hardware-assisted tracing technologies.
They used a CY7C68013A based logic analyzer (controlled by sigrok) to collect the ETM trace.
Unfortunately, I failed to understand the technical details provided by the authors in the paper, and there was no clear description of their workflow.
I found this repository which presumably inspired the authors of HATBED.
A Mini Experiment with Raspberry Pi Pico
I came across a forum post on tracing for Raspberry Pi Pico 2. The motivation behind this discussion is that the ARM Cortex M33 cores inside the RP2350 (found on the Pico 2 / Pico 2 W) support ETMv4, and Pico 2 was just released in 2024 hence not too much about this potential tracing capability has been explored.
The main contributor of the forum post open sourced his github repository etm-trace-rp2350, which essentially contains a GDB script that helps configuring the ETM on Pico 2 for trace collection.
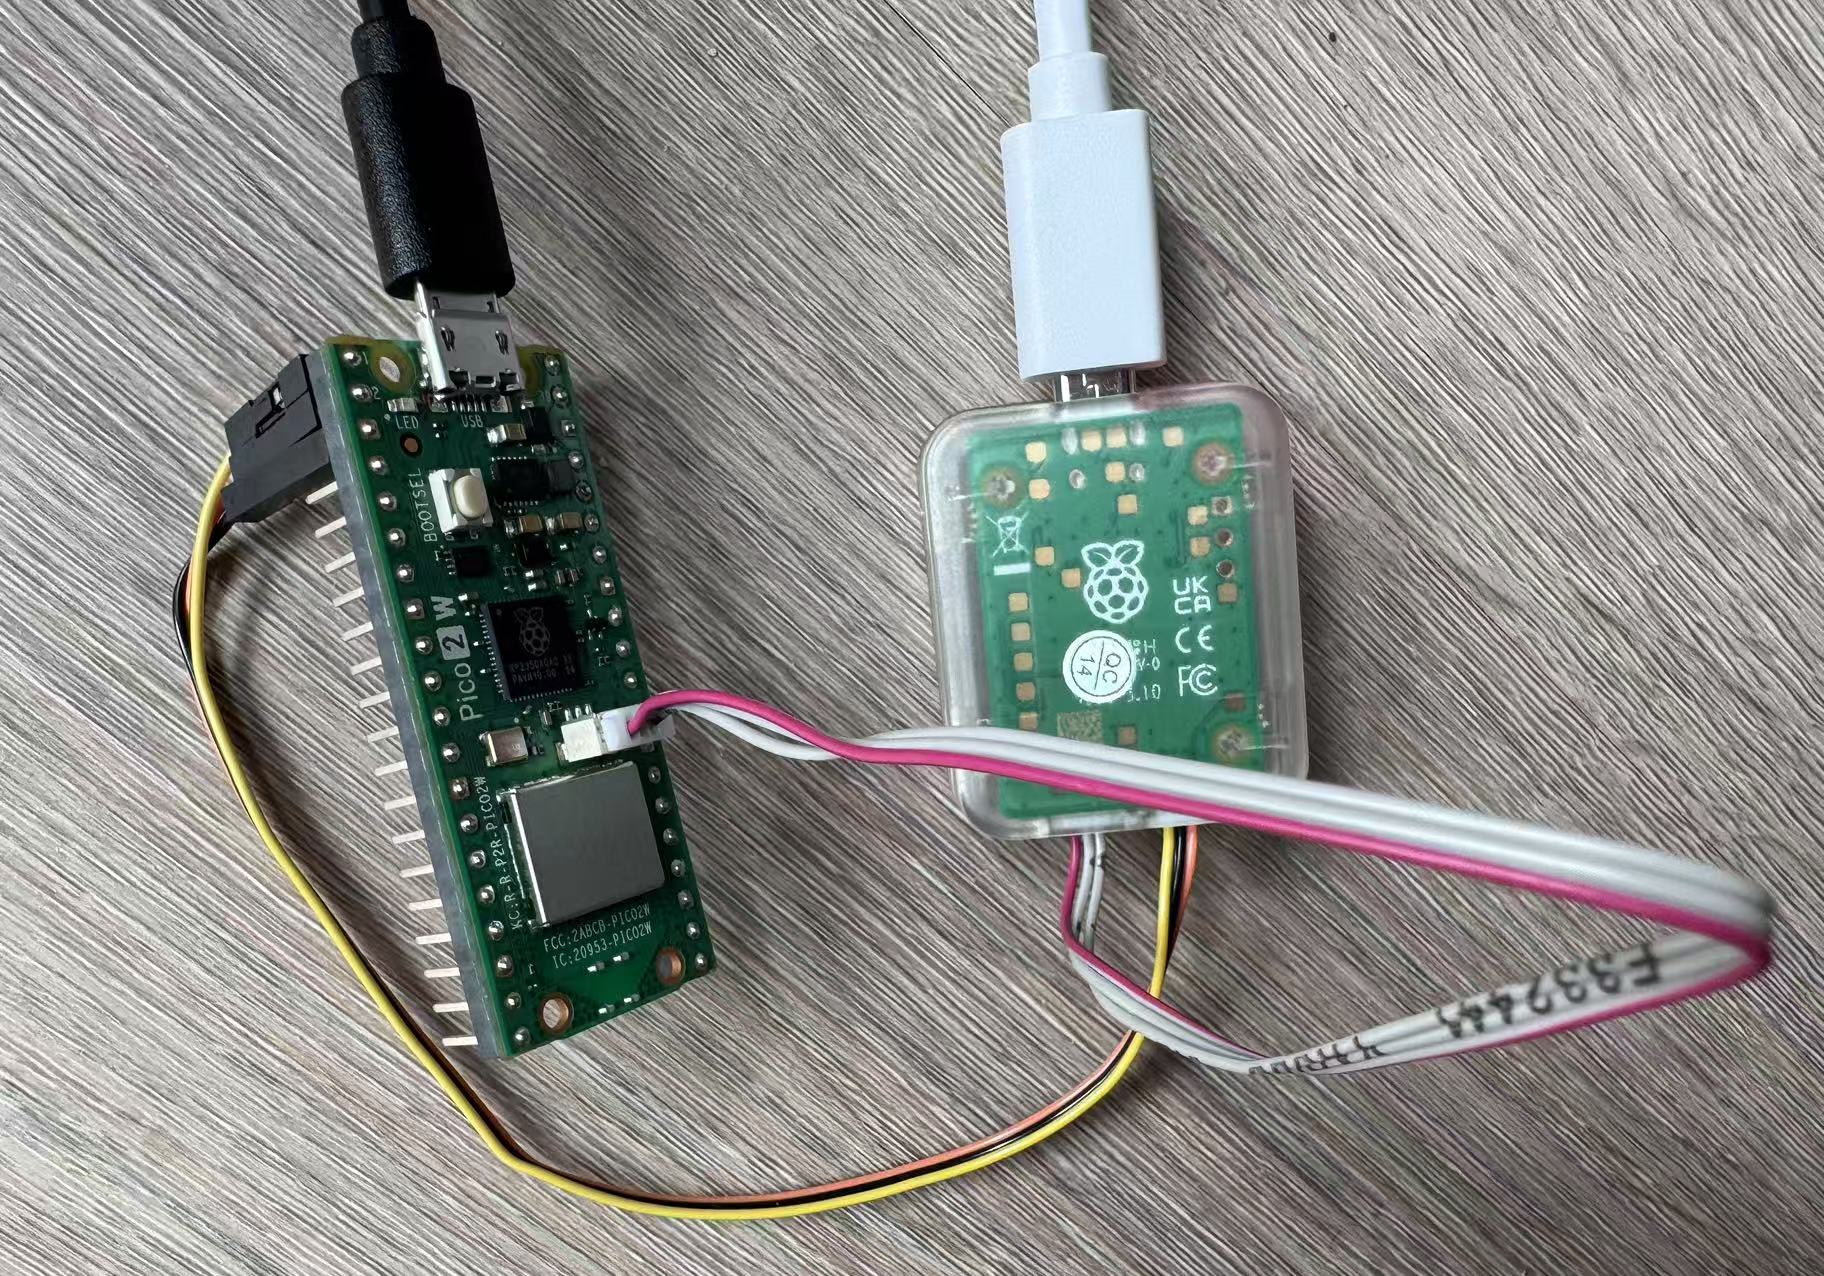
I did a mini experiment with a Raspberry Pi Pico 2 W and a Raspberry Pi Debug Probe and managed to got the expected trace output. I recorded the steps I took for this setup here for future reference.
Below is a photo of the hardware connection.
References
-
FrankenTrace: Low-Cost, Cycle-Level, Widely Applicable Program Execution Tracing for ARM Cortex-M SoC https://doi.org/10.1145/3576914.3587521
-
𝜇AFL: Non-intrusive Feedback-driven Fuzzing for Microcontroller Firmware https://dl.acm.org/doi/10.1145/3510003.3510208
-
HATBED: A Distributed Hardware Assisted Testbed for Non-invasive Profiling of IoT Devices https://dl.acm.org/doi/10.1145/3312480.3313172
-
Tracing on STM32 discovery https://essentialscrap.com/tips/arm_trace/theory.html
-
Ninja: Towards Transparent Tracing and Debugging on ARM https://dl.acm.org/doi/10.5555/3241189.3241193
-
Embedded Trace Macrocell Architecture Specification ETMv1.0 to ETMv3.5 https://developer.arm.com/documentation/ihi0014/q (ETM Arch Spec v3.5)
-
Embedded Trace Macrocell Architecture Specification ETMv4.0 to ETM4.6 https://developer.arm.com/documentation/ihi0064/hb (ETM Arch Spec v4.0)
-
ETM instruction tracing for RP2350 https://forums.raspberrypi.com/viewtopic.php?t=383655