
My Distillation of The Linux Kernel Documentation
In this blog, I’m trying to summarize some of the topics in Linux kernel development that I learned while reading its official documentation.
I’m currently working with the v6.11 version of the Linux kernel. You can find the main documentation page here.
Table of Contents
Static Keys 🔗
Static keys allows the inclusion of seldom used features in performance-sensitive fast-path kernel code, via a GCC feature and a code patching technique.
To understand static keys, we need to first introduce the concept of “jump label”, which is enabled by asm goto in gcc (v4.5). Using the ‘asm goto’, we can create branches that are either taken or not taken by default, without the need to check memory. Then, at run-time, we can patch the branch site to change the branch direction.
For example, if we have a simple branch:
if (static_branch_unlikely(&key))
        printk("I am the true branch\n");
By default, the if statemnet should be false, and we don’t want to evaluate this condition each time this statement is reached. The solution is to simply encode nops into this part of code without any condition check, which means by default nothing happens with these two lines of code. During runtime, if we actually want to execute the branch, we can enable it by replacing the nops with a jmp to the printk statement compiled at somewhere nearby.
Static keys is just an API that allows us to use such feature to implement “jump label patching” mechanism conveniently. An example is:
DEFINE_STATIC_KEY_FALSE(key);

...

if (static_branch_unlikely(&key))
        do unlikely code
else
        do likely code

...
static_branch_enable(&key);         // Switching the jump label
...
static_branch_disable(&key);        // Switching the jump label
...
Note that the if condition is no longer checked during runtime, but controlled manually by enabling/disabling the static branch.
Note that switching branches results in some locks being taken, particularly the CPU hotplug lock (in order to avoid races against CPUs being brought in the kernel while the kernel is getting patched).
Since statics key is based on jump labels, one can disable static keys entirely by setting CONFIG_JUMP_LABEL=n when configuring kernel compilation.
Livepatch 🔗
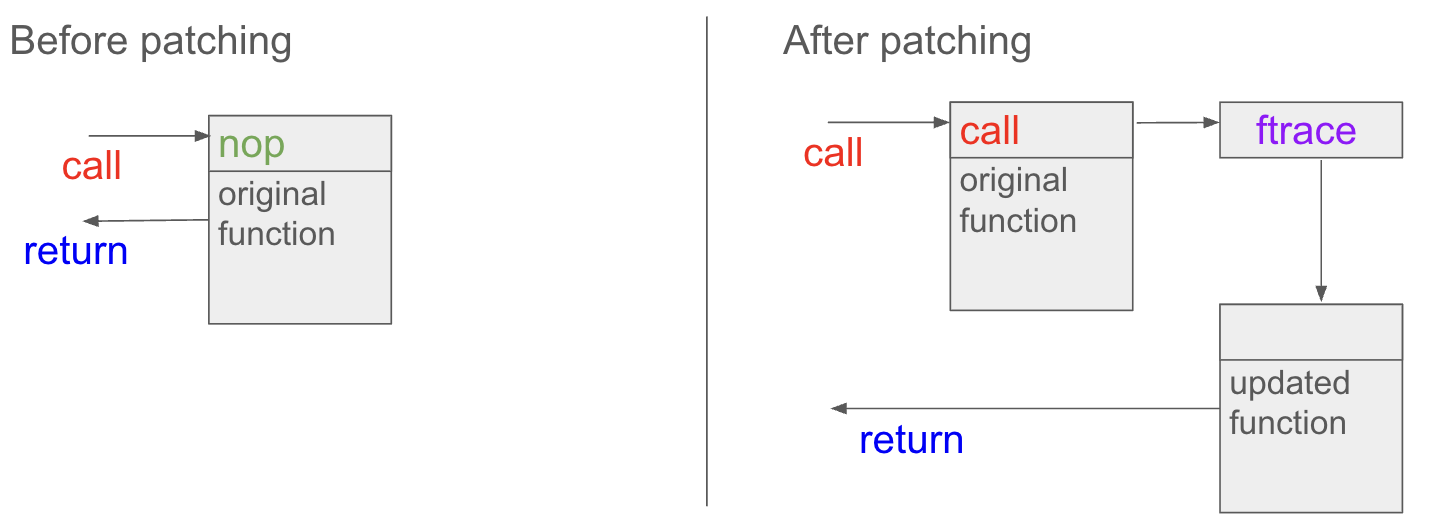
Livepatching allows users to redirect function calls so that patches can be applied to critical functions without rebooting the system.
There are multiple mechanisms in the Linux kernel that are directly related to redirection of code execution; namely: kernel probes, function tracing, and livepatching. All three approaches need to modify the existing code at runtime. Therefore they need to be aware of each other and not step over each other’s toes. See this section for more details.
Livepatch has a consistency model (such consistency model tend to be super complicated, think about the case when an updated function involves changes of locking, and needs one or more other functions to be updated at the same time) which is a hybrid of kGraft and kpatch: it uses kGraft’s per-task consistency and syscall barrier switching combined with kpatch’s stack trace switching. There are also a number of fallback options which make it quite flexible.
A diagram demonstrating a naive understanding of livepatch:
Limitations of livepatch:
- Only functions that can be traced could be patched.
- Livepatch is based on the dynamic ftrace. In particular, functions implementing ftrace or the livepatch ftrace handler could not be patched. Otherwise, the code would end up in an infinite loop :)
- Livepatch works reliably only when the dynamic ftrace is located at the very beginning of the function.
- Kretprobes using the ftrace framework conflict with the patched functions.
CoreSight - ARM Hardware Trace 🔗
Coresight is an umbrella of technologies allowing for the debugging of ARM based SoC. It includes solutions for JTAG and HW assisted tracing.
ARM has developed a HW assisted tracing solution by means of different components, each being added to a design at synthesis time to cater to specific tracing needs. Components are generally categorised as source, link and sinks and are (usually) discovered using the AMBA bus.
A typical coresight system would look like this:
 *****************************************************************
**************************** AMBA AXI  ****************************===||
 *****************************************************************    ||
       ^                    ^                            |            ||
       |                    |                            *            **
    0000000    :::::     0000000    :::::    :::::    @@@@@@@    ||||||||||||
    0 CPU 0<-->: C :     0 CPU 0<-->: C :    : C :    @ STM @    || System ||
 |->0000000    : T :  |->0000000    : T :    : T :<--->@@@@@     || Memory ||
 |  #######<-->: I :  |  #######<-->: I :    : I :      @@@<-|   ||||||||||||
 |  # ETM #    :::::  |  # PTM #    :::::    :::::       @   |
 |   #####      ^ ^   |   #####      ^ !      ^ !        .   |   |||||||||
 | |->###       | !   | |->###       | !      | !        .   |   || DAP ||
 | |   #        | !   | |   #        | !      | !        .   |   |||||||||
 | |   .        | !   | |   .        | !      | !        .   |      |  |
 | |   .        | !   | |   .        | !      | !        .   |      |  *
 | |   .        | !   | |   .        | !      | !        .   |      | SWD/
 | |   .        | !   | |   .        | !      | !        .   |      | JTAG
 *****************************************************************<-|
*************************** AMBA Debug APB ************************
 *****************************************************************
  |    .          !         .          !        !        .    |
  |    .          *         .          *        *        .    |
 *****************************************************************
******************** Cross Trigger Matrix (CTM) *******************
 *****************************************************************
  |    .     ^              .                            .    |
  |    *     !              *                            *    |
 *****************************************************************
****************** AMBA Advanced Trace Bus (ATB) ******************
 *****************************************************************
  |          !                        ===============         |
  |          *                         ===== F =====<---------|
  |   :::::::::                         ==== U ====
  |-->:: CTI ::<!!                       === N ===
  |   :::::::::  !                        == N ==
  |    ^         *                        == E ==
  |    !  &&&&&&&&&       IIIIIII         == L ==
  |------>&& ETB &&<......II     I        =======
  |    !  &&&&&&&&&       II     I           .
  |    !                    I     I          .
  |    !                    I REP I<..........
  |    !                    I     I
  |    !!>&&&&&&&&&       II     I           *Source: ARM ltd.
  |------>& TPIU  &<......II    I            DAP = Debug Access Port
          &&&&&&&&&       IIIIIII            ETM = Embedded Trace Macrocell
              ;                              PTM = Program Trace Macrocell
              ;                              CTI = Cross Trigger Interface
              *                              ETB = Embedded Trace Buffer
         To trace port                       TPIU= Trace Port Interface Unit
                                             SWD = Serial Wire Debug
Device tree bindings are stored in Documentation/devicetree/bindings/arm/arm,coresight-*.yaml files.
Registration process:
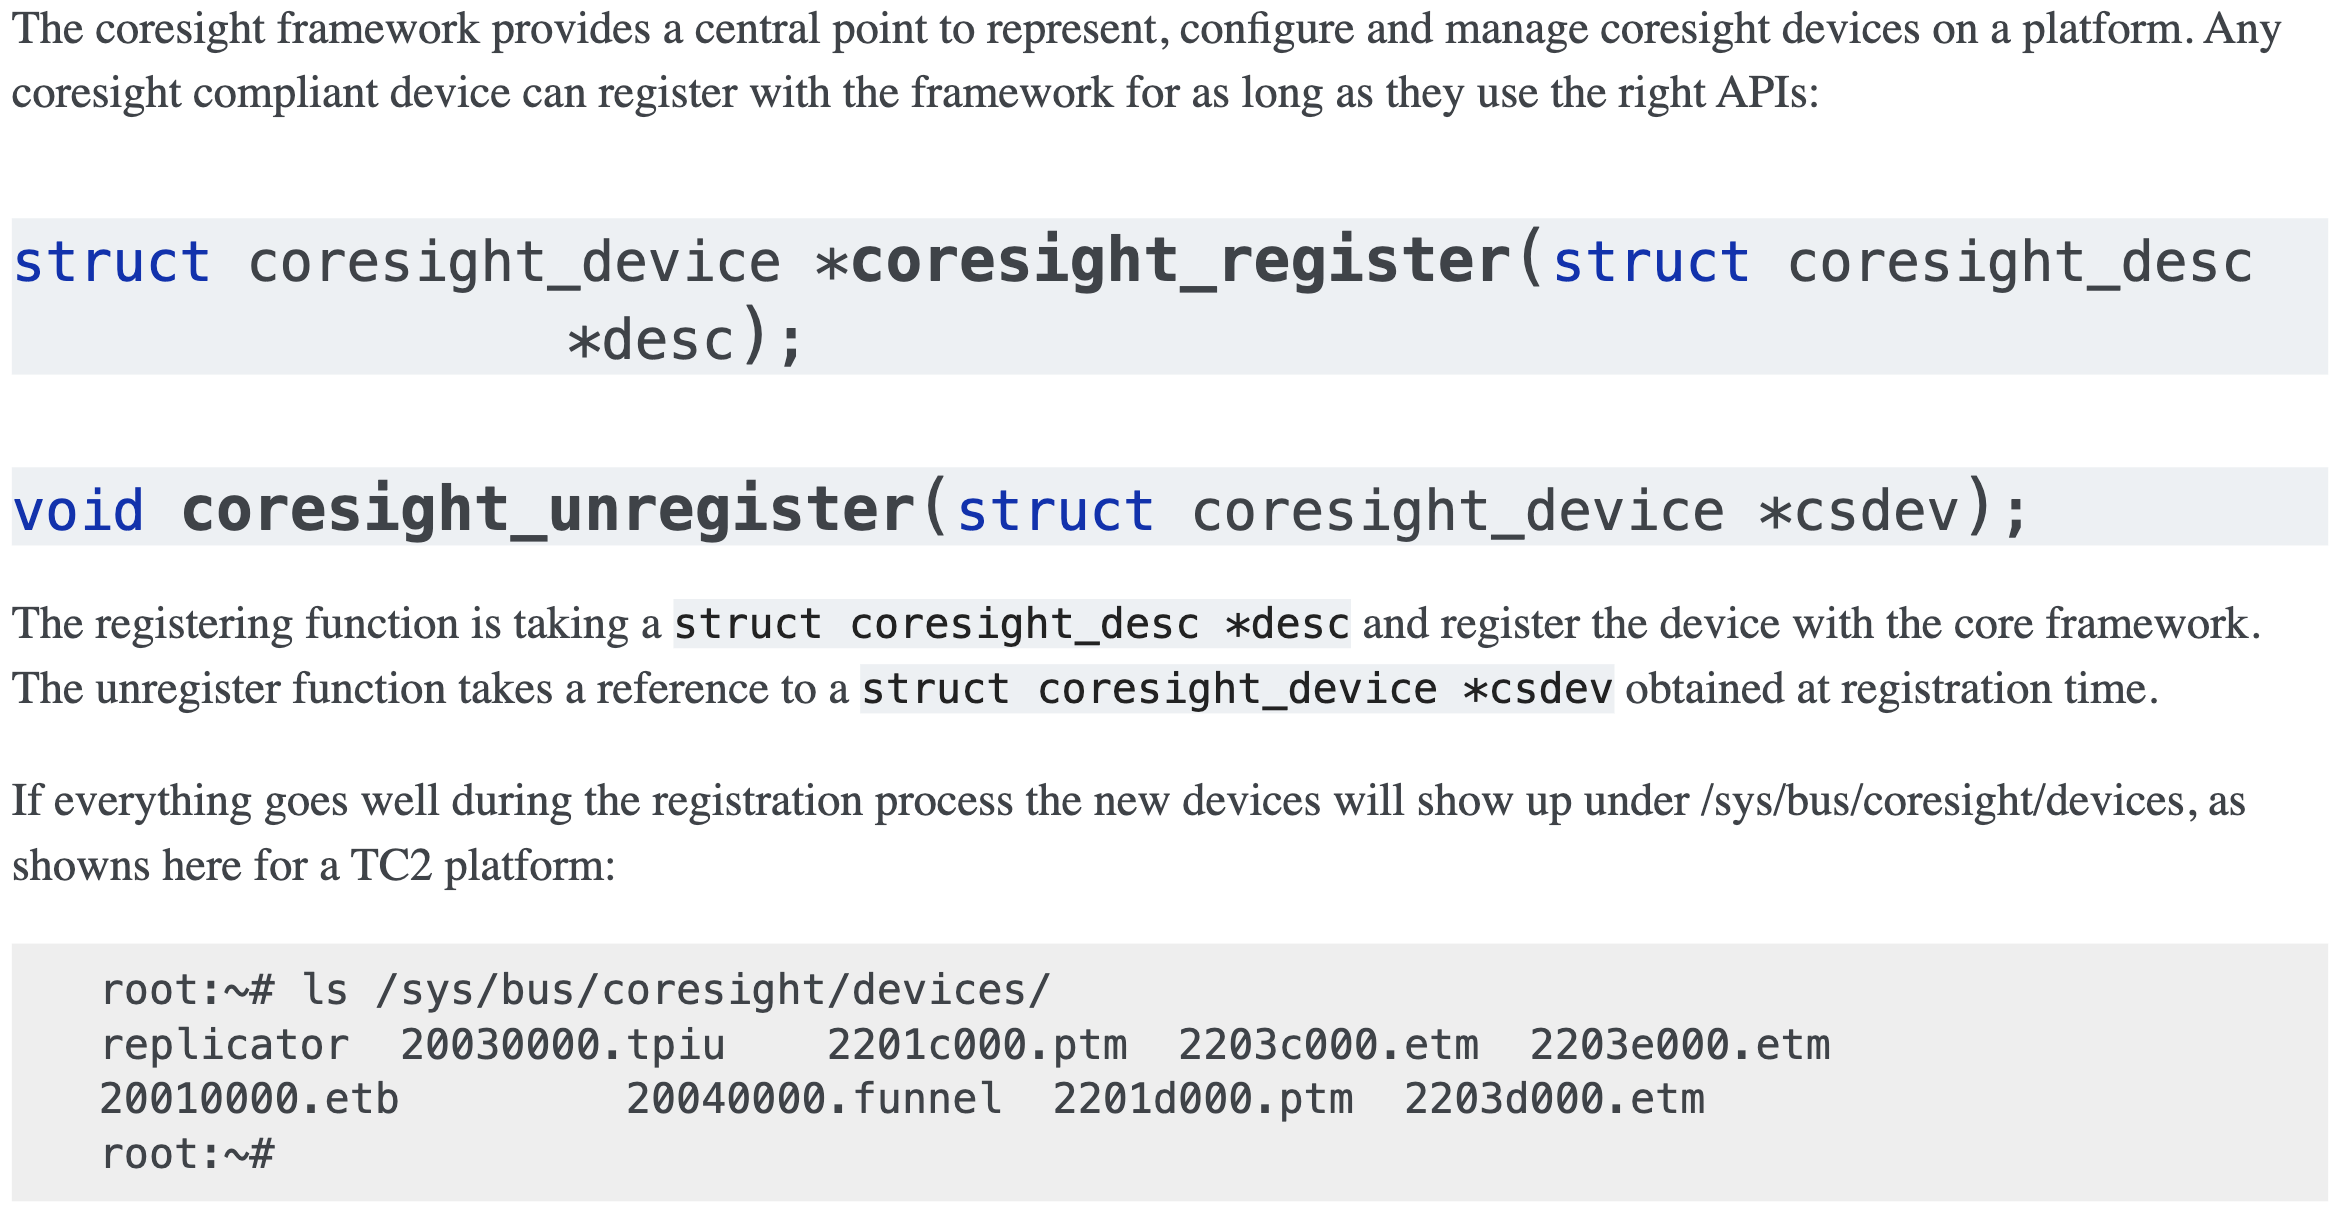
The devices are named with the base physical address of the device + the device type.
However, with the introduction of ACPI support, the names of the real devices are a bit cryptic and non-obvious. In short, the devices are now named with device type and a number indicating either the CPU it associates to (e.g. etm0) or just for ordering (e.g. funnel0). Examples are:
root:~# ls /sys/bus/coresight/devices/
 etm0     etm1     etm2         etm3  etm4      etm5      funnel0
 funnel1  funnel2  replicator0  stm0  tmc_etf0  tmc_etr0  tpiu0
Each CoreSight component has a connections directory which will contain links to other CoreSight components. This allows the user to explore the trace topology and for larger systems, determine the most appropriate sink for a given source. For example, a typical arrangement for a etm0 on a Juno platform will be:
linaro-developer:~# ls - l /sys/bus/coresight/devices/etm0/connections
<file details>  cti_cpu0 -> ../../../23020000.cti/cti_cpu0
<file details>  nr_links
<file details>  out:0 -> ../../../230c0000.funnel/funnel2
There are two ways to use the Coresight framework:
- using the
perfcommand line tools. - interacting directly with the Coresight devices using the sysFS interface.
sysFS interface: Details can be found in this section, the main idea is to enable/disable tracing by writing 0/1 into files like enable_sink and enable_source under the related device (e.g. etb) directories.
Perf way: Coresight tracers are represented using the Perf framework’s Performance Monitoring Unit (PMU) abstraction. As such the perf framework takes charge of controlling when tracing gets enabled based on when the process of interest is scheduled. When configured in a system, Coresight PMUs will be listed when queried by the perf command line tool:
inaro@linaro-nano:~$ ./perf list pmu

    List of pre-defined events (to be used in -e):

    cs_etm// [Kernel PMU event]
Open Firmware and Devicetree 🔗
I found Device Tree: hardware description for everybody! a helpful resource for understanding the concept of device tree. Some of the screenshots below were made when watching this tutorial.
Devicetree (DT) is a data structure and language for describing hardware. Structurally, the DT is a tree, or acyclic graph with named nodes, and nodes may have an arbitrary number of named properties encapsulating arbitrary data. An OS uses the DT to discover the topology of the hardware at runtime, and thereby supports a majority of available hardware without hard coded information.
It’s worth noting that the kernel will use data in the DT to identify the specific machine it is running on.
Devicetree is passed to the kernel at boot time as a binary blob called the Device Tree Binary (dtb), which represents a flattened device tree (FDT). During early kernel initialization, the function unflatten_device_tree() is called to unflatten the DT, converting the DT blob into an internal, more efficient runtime structure.
To apply dynamic changes to the DT at runtime, the device tree changesets mechanism can be used internally. From the user’s perspective, a device tree overlay (.dtbo) binary blob is needed when requesting an update to the live DT.
Source code for DT is in the format of Devicetree Sources (DTS). Besides .dts files, there are also .dtsi files. .dtsi files are included files, while .dts files are final device trees that will be accepted as inputs to the device tree compiler (dtc). Typically, .dtsi files will contain definitions of SoC-level information (or sometimes definitions common to several almost identical boards), and the .dts files contain the board-level information. See this section for details about DTS coding style.
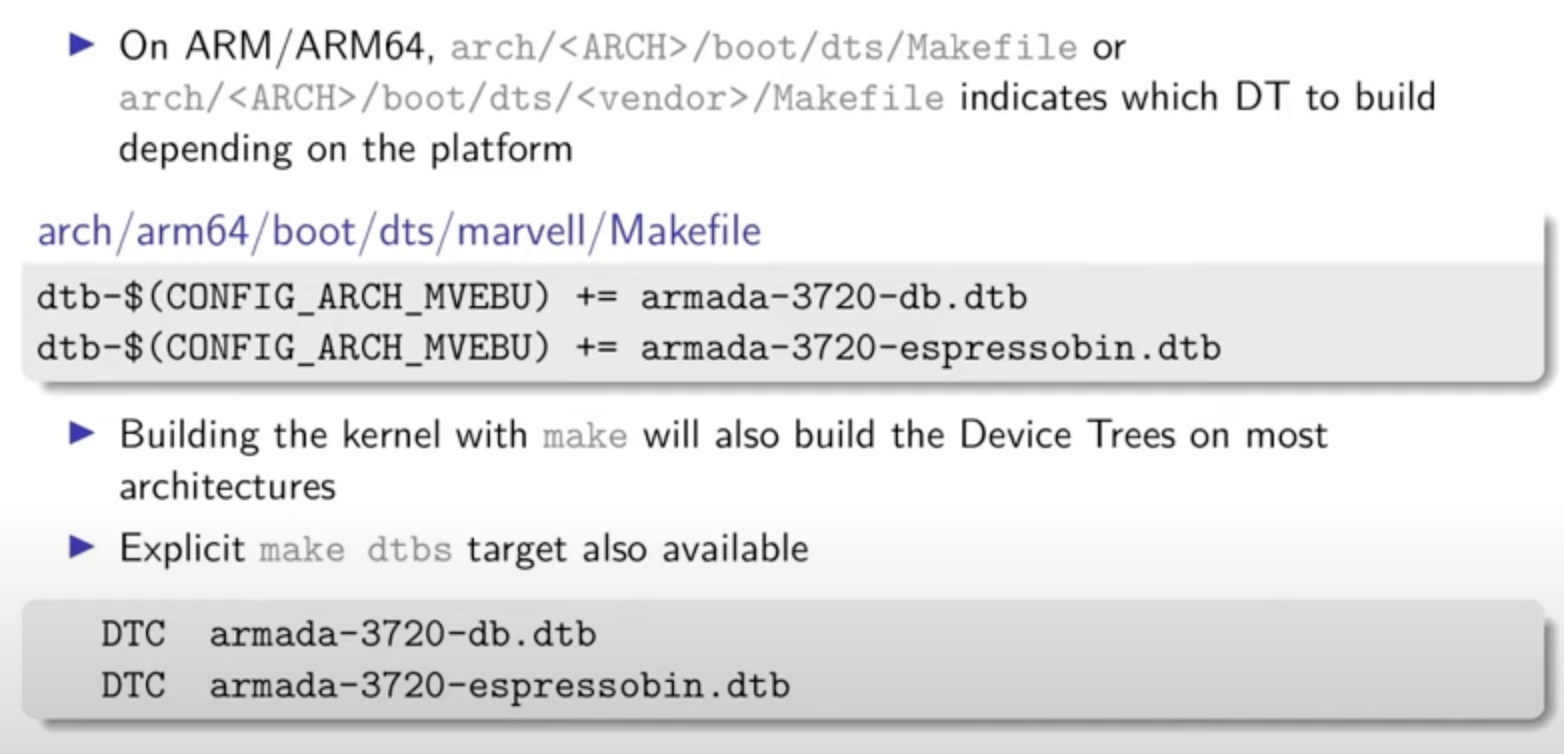
For building DT in Linux,