


Having Fun with ARM64 Linux Kernel
Lately, I’ve been working on a project related to recording Linux kernel execution traces at the object code level. During this process, I had the opportunity to work with the ARM64 architecture on Linux. I decided to write this blog to capture some of the highlights I learned along the way.
Table of Contents
- Objdump ARM Kernel
- Booting Process - A Brief Introduction
.wordDirectives andudfInstructions- Runtime Patching
Objdump ARM Kernel
Since I’m working with an x86-64 server, performing an object dump on ARM64 ELF files can’t be done simply using the objdump program. Instead, I had to use the aarch64-linux-gnu-objdump program. This tool can be installed on Ubuntu via the binutils-aarch64-linux-gnu package.
The command I used to objdump an ARM64 kernel image is:
aarch64-linux-gnu-objdump -d -z vmlinux
Note that the -z flag in the command above ensures that the full object dump is shown, preventing zeroed lines from being collapsed into ellipses (…).
Booting Process - A Brief Introduction
The beginning of ARM64 kernel image objdump looks like:
/linux/vmlinux:     file format elf64-littleaarch64


Disassembly of section .head.text:

ffff800080000000 <_text>:
ffff800080000000:	fa405a4d 	ccmp	x18, #0x0, #0xd, pl	// pl = nfrst
ffff800080000004:	14713c37 	b	ffff800081c4f0e0 <primary_entry>
ffff800080000008:	00000000 	.word	0x00000000
ffff80008000000c:	00000000 	.word	0x00000000
ffff800080000010:	02c20000 	.word	0x02c20000
ffff800080000014:	00000000 	.word	0x00000000
ffff800080000018:	0000000a 	.word	0x0000000a
ffff80008000001c:	00000000 	.word	0x00000000
ffff800080000020:	00000000 	.word	0x00000000
ffff800080000024:	00000000 	.word	0x00000000
ffff800080000028:	00000000 	.word	0x00000000
ffff80008000002c:	00000000 	.word	0x00000000
ffff800080000030:	00000000 	.word	0x00000000
ffff800080000034:	00000000 	.word	0x00000000
ffff800080000038:	644d5241 	.word	0x644d5241
ffff80008000003c:	00000040 	.word	0x00000040
ffff800080000040:	00004550 	.word	0x00004550
ffff800080000044:	0002aa64 	.word	0x0002aa64
ffff800080000048:	00000000 	.word	0x00000000
The first two lines are instructions executed when the kernel is entered from the bootloader. primary_entry function can be found in linux/arch/arm64/kernel/head.S source file. Let’s take a look at the corresponding snippet:
/*
 * Kernel startup entry point.
 * ---------------------------
 *
 * The requirements are:
 *   MMU = off, D-cache = off, I-cache = on or off,
 *   x0 = physical address to the FDT blob.
 *
 * Note that the callee-saved registers are used for storing variables
 * that are useful before the MMU is enabled. The allocations are described
 * in the entry routines.
 */
	__HEAD
	/*
	 * DO NOT MODIFY. Image header expected by Linux boot-loaders.
	 */
	efi_signature_nop			// special NOP to identity as PE/COFF executable
	b	primary_entry			// branch to kernel start, magic
	.quad	0				// Image load offset from start of RAM, little-endian
	le64sym	_kernel_size_le			// Effective size of kernel image, little-endian
	le64sym	_kernel_flags_le		// Informative flags, little-endian
	.quad	0				// reserved
	.quad	0				// reserved
	.quad	0				// reserved
	.ascii	ARM64_IMAGE_MAGIC		// Magic number
	.long	.Lpe_header_offset		// Offset to the PE header.

	__EFI_PE_HEADER
To better understand the connection between the head.S snippet and the objdump results, I made the following annotation:
/linux/vmlinux:     file format elf64-littleaarch64


Disassembly of section .head.text:

ffff800080000000 <_text>:
ffff800080000000:	fa405a4d 	ccmp	x18, #0x0, #0xd || efi_signature_nop // special NOP to identity as PE/COFF executable
ffff800080000004:	14713c37 	b	ffff800081c4f0e0    || b primary_entry // branch to kernel start, magic
ffff800080000008:	00000000 	.word	0x00000000      || .quad    0 // Image load offset from start of RAM, little-endian
ffff80008000000c:	00000000 	.word	0x00000000
ffff800080000010:	02c20000 	.word	0x02c20000      || le64sym _kernel_size_le // Effective size of kernel image, little-endian
ffff800080000014:	00000000 	.word	0x00000000
ffff800080000018:	0000000a 	.word	0x0000000a      || le64sym _kernel_flags_le // Informative flags, little-endian
ffff80008000001c:	00000000 	.word	0x00000000
ffff800080000020:	00000000 	.word	0x00000000      || .quad    0 // reserved
ffff800080000024:	00000000 	.word	0x00000000
ffff800080000028:	00000000 	.word	0x00000000      || .quad    0 // reserved
ffff80008000002c:	00000000 	.word	0x00000000
ffff800080000030:	00000000 	.word	0x00000000      || .quad    0 // reserved
ffff800080000034:	00000000 	.word	0x00000000
ffff800080000038:	644d5241 	.word	0x644d5241      || .ascii	ARM64_IMAGE_MAGIC // Magic number
ffff80008000003c:	00000040 	.word	0x00000040      || .long	.Lpe_header_offset // Offset to the PE header.
ffff800080000040:	00004550 	.word	0x00004550
ffff800080000044:	0002aa64 	.word	0x0002aa64
ffff800080000048:	00000000 	.word	0x00000000
...                                                     || _EFI_PE_HEADER
So, the .word directives coming after the first two instructions are representing data or instructions used by booting and kernel initial setup process.
MMU Enabling
When recording the entire booting process of ARM64 Linux kernel, I noticed that the start of the booting process was not captured by my tool when using virtual addresses. This happens because the MMU (Memory Management Unit) is not enabled at the very beginning of kernel initialization.
In linux/arch/arm64/kernel/head.S I located the following snippet at the end of primary_entry function:
SYM_CODE_START(primary_entry)
...
	/*
	 * The following calls CPU setup code, see arch/arm64/mm/proc.S for
	 * details.
	 * On return, the CPU will be ready for the MMU to be turned on and
	 * the TCR will have been set.
	 */
	bl	__cpu_setup			// initialise processor
	b	__primary_switch
SYM_CODE_END(primary_entry)
Following to the comment, I found the __cpu_setup function in linux/arch/arm64/mm/proc.S, it comes with a clear comment saying:
/*
 *	__cpu_setup
 *
 *	Initialise the processor for turning the MMU on.
 *
 * Output:
 *	Return in x0 the value of the SCTLR_EL1 register.
 */
With this, I can conclude the following takeaway:
- When ARM64 Linux kernel boots, the bootloader runs at the beginning of the entire process. Then, the execution flow starts in kernel image from its beginning, where
primary_entryfunction is the first one to be called. The kernel image reserves a section of .word at the beginning which contains data for booting and kernel initialization (e.g. ARM ELF magic number, kernel image size).primary_entryfunction can be found inlinux/arch/arm64/kernel/head.S, at the end of this function there is a function call to__cpu_setup, where the MMU is set up and you get virtual addresses mapped to physical ones.
How Does QEMU Emulate Kernel Booting?
There are two options to load a kernel in QEMU:
- Boot via UEFI firmware.
- Direct Linux kernel boot.
When booting via UEFI firmware, pass in command-line arguments like -bios QEMU_EFI.fd when launching QEMU, and QEMU loads a UEFI firmware binary into memory, which runs like it would on real hardware.
When booting directly as Linux kernel, pass in command-line arguments like -kernel Image, QEMU will load the kernel into guest RAM, then it will load the device tree and set up CPU registers, after which it will transfer control to the kernel.
.word Directives and udf Instructions
In ARM64 kernel image objdump, one can observe many instances of .word directives, examples can be found in the Some Booting Process Introduction section above. These .word entries contain data rather than executable code.
A question comes naturally: How does the objdump program tell if a 4 byte binary in an ELF file is an instruction or a .word data?
Besides .word directives, one can also observe udf instances, for example:
ffff800080010d48:       cb2063e0        sub     x0, sp, x0
ffff800080010d4c:       f274cc1f        tst     x0, #0xfffffffffffff000
ffff800080010d50:       54001581        b.ne    ffff800080011000 <__bad_stack>  // b.any
ffff800080010d54:       cb2063ff        sub     sp, sp, x0
ffff800080010d58:       d53bd060        mrs     x0, tpidrro_el0
ffff800080010d5c:       14000262        b       ffff8000800116e4 <el0t_64_fiq>
ffff800080010d60:       00000000        udf     #0
ffff800080010d64:       00000000        udf     #0
ffff800080010d68:       00000000        udf     #0
ffff800080010d6c:       00000000        udf     #0
ffff800080010d70:       00000000        udf     #0
ffff800080010d74:       00000000        udf     #0
ffff800080010d78:       00000000        udf     #0
ffff800080010d7c:       00000000        udf     #0
ffff800080010d80:       14000003        b       ffff800080010d8c <vectors+0x58c>
These udf instructions are used as paddings and never got executed. In general, udf instructions are in the form of udf #imm16, meaning 0x00000009 could also be a udf instruction intrepreted as udf #9.
So, another natural question is: How does the objdump program decides if a 0x00000000 is translated to .word 00000000 or udf #0?
How Are .word and udf Recognized?
I did a tiny experiment with the following example as example.s:
    .section .text
    .global _start
_start:
    mov x0, #1             // set x0 = 1 (exit code)
    .word 0xd2800020
    udf #0
    .word 0x00000000
    mov x1, #2             // set x1 = 2
    mov x8, #93            // syscall number for exit on ARM64
    svc #0                 // syscall
On a x86 machine, I assembled and loaded it for ARM64.
aarch64-linux-gnu-as example.s -o example.o
aarch64-linux-gnu-ld example.o -o example
Next, I disassembled it with aarch64-linux-gnu-objdump:
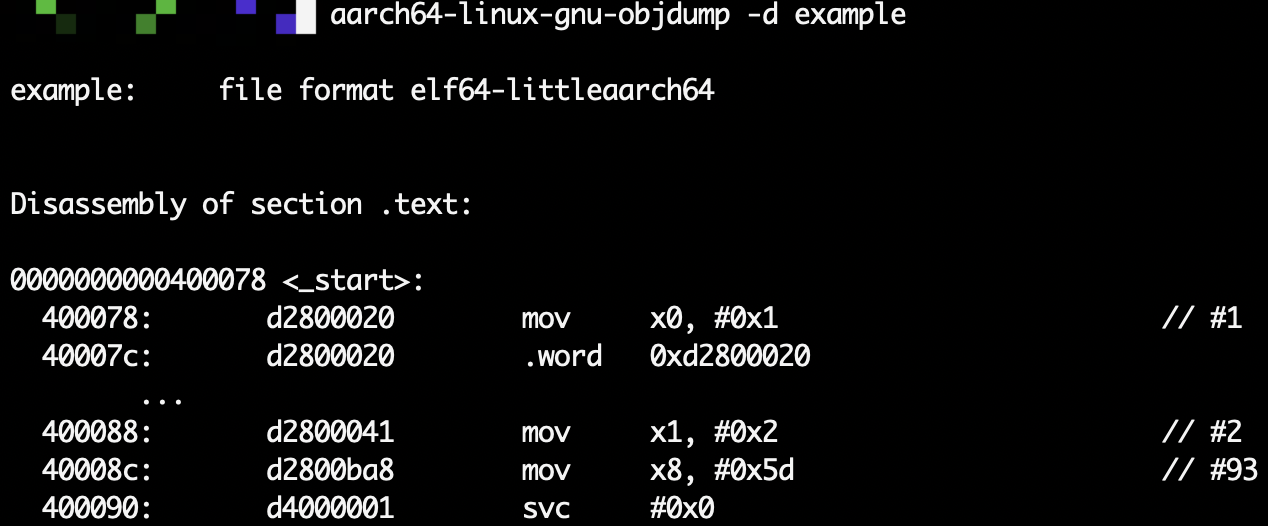
Notice how the two consective 0x00000000 got collapsed into ellipses!
I added the -z flag to ask for the complete objdump:
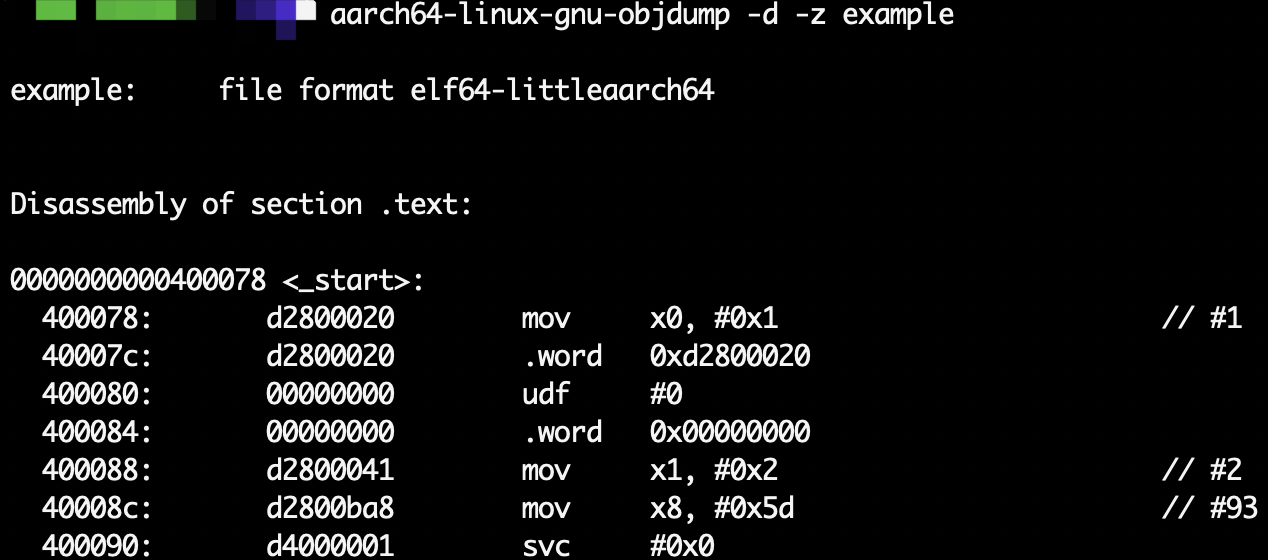
It turned out that the aarch64-linux-gnu-objdump program correctly recognizes both .word and udf!!
Now, take a look at how the actual binary looks like in example:
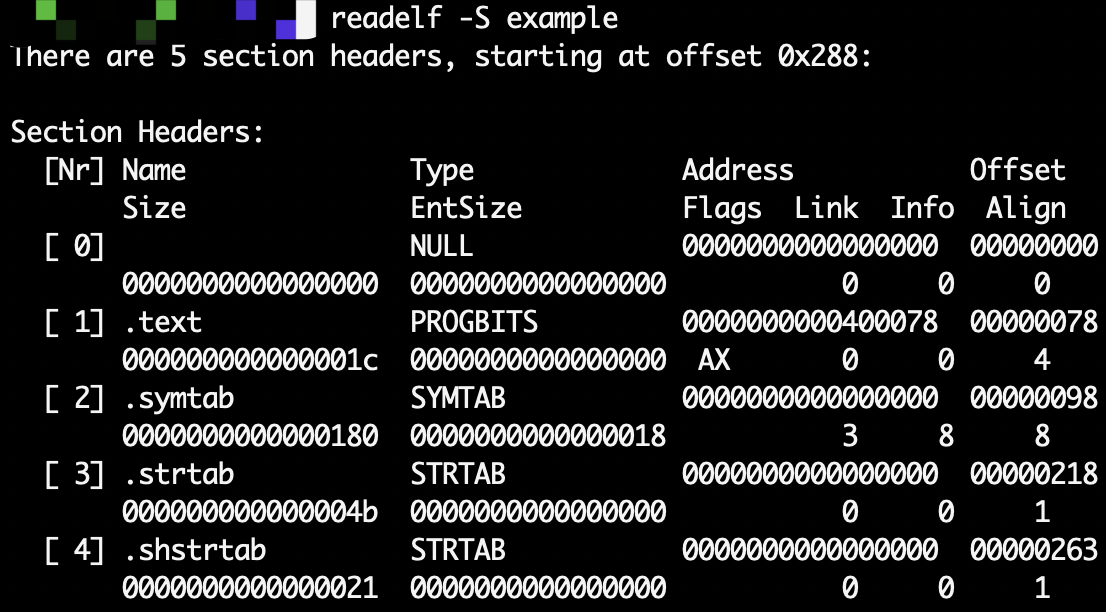

Well, it appears that within the .text section the raw bytes for 0xd2800020 and 0x00000000 pairs are indistinguishable!
So, the takeaway is:
In ELF files there are debug info (like DWARF) and other symbol info (like function boundaries, labels, or assembler-generated metadata) that helps
objdumpprogram to recognize.wordandudfentries in.textsection, the raw bytes themselves don’t really reflect such differences.
Runtime Patching
Prologue
An interesting instance caught my attention when I was analyzing the execution trace of the ARM64 Linux kernel with QEMU.
In the objdump of the kernel image, there is the following snippet containing an NOP instruction at 0xffff800080018800:
ffff8000800187b0 <copy_thread>:
ffff8000800187b0:	d503233f 	paciasp
ffff8000800187b4:	a9bb7bfd 	stp	x29, x30, [sp, #-80]!
...
ffff8000800187e4:	f9401275 	ldr	x21, [x19, #32]
ffff8000800187e8:	f9401a96 	ldr	x22, [x20, #48]
ffff8000800187ec:	f9402298 	ldr	x24, [x20, #64]
ffff8000800187f0:	9441b294 	bl	ffff800081085240 <__memset>
ffff8000800187f4:	aa1303e0 	mov	x0, x19
ffff8000800187f8:	97fffa41 	bl	ffff8000800170fc <fpsimd_flush_task_state>
ffff8000800187fc:	1400002c 	b	ffff8000800188ac <copy_thread+0xfc>
ffff800080018800:	d503201f 	nop
ffff800080018804:	f9403280 	ldr	x0, [x20, #96]
ffff800080018808:	d287d604 	mov	x4, #0x3eb0                	// #16048
ffff80008001880c:	8b0402b9 	add	x25, x21, x4
ffff800080018810:	b5000700 	cbnz	x0, ffff8000800188f0 <copy_thread+0x140>
ffff800080018814:	914012b5 	add	x21, x21, #0x4, lsl #12
However, in the actually emulation by QEMU, I found that the NOP got swapped with the branch instruction before it!
That’s saying, in objdump of kernel image we observe
ffff8000800187fc:	1400002c 	b	ffff8000800188ac <copy_thread+0xfc>
ffff800080018800:	d503201f 	nop
while in QEMU emulation there was
ffff8000800187fc:	d503201f 	nop
ffff800080018800:	1400002c 	b	ffff8000800188ac <copy_thread+0xfc>
To double-check that in QEMU emulation the instructions really got swappped, I used the gdb-multiarch program to inspect runtime memory:
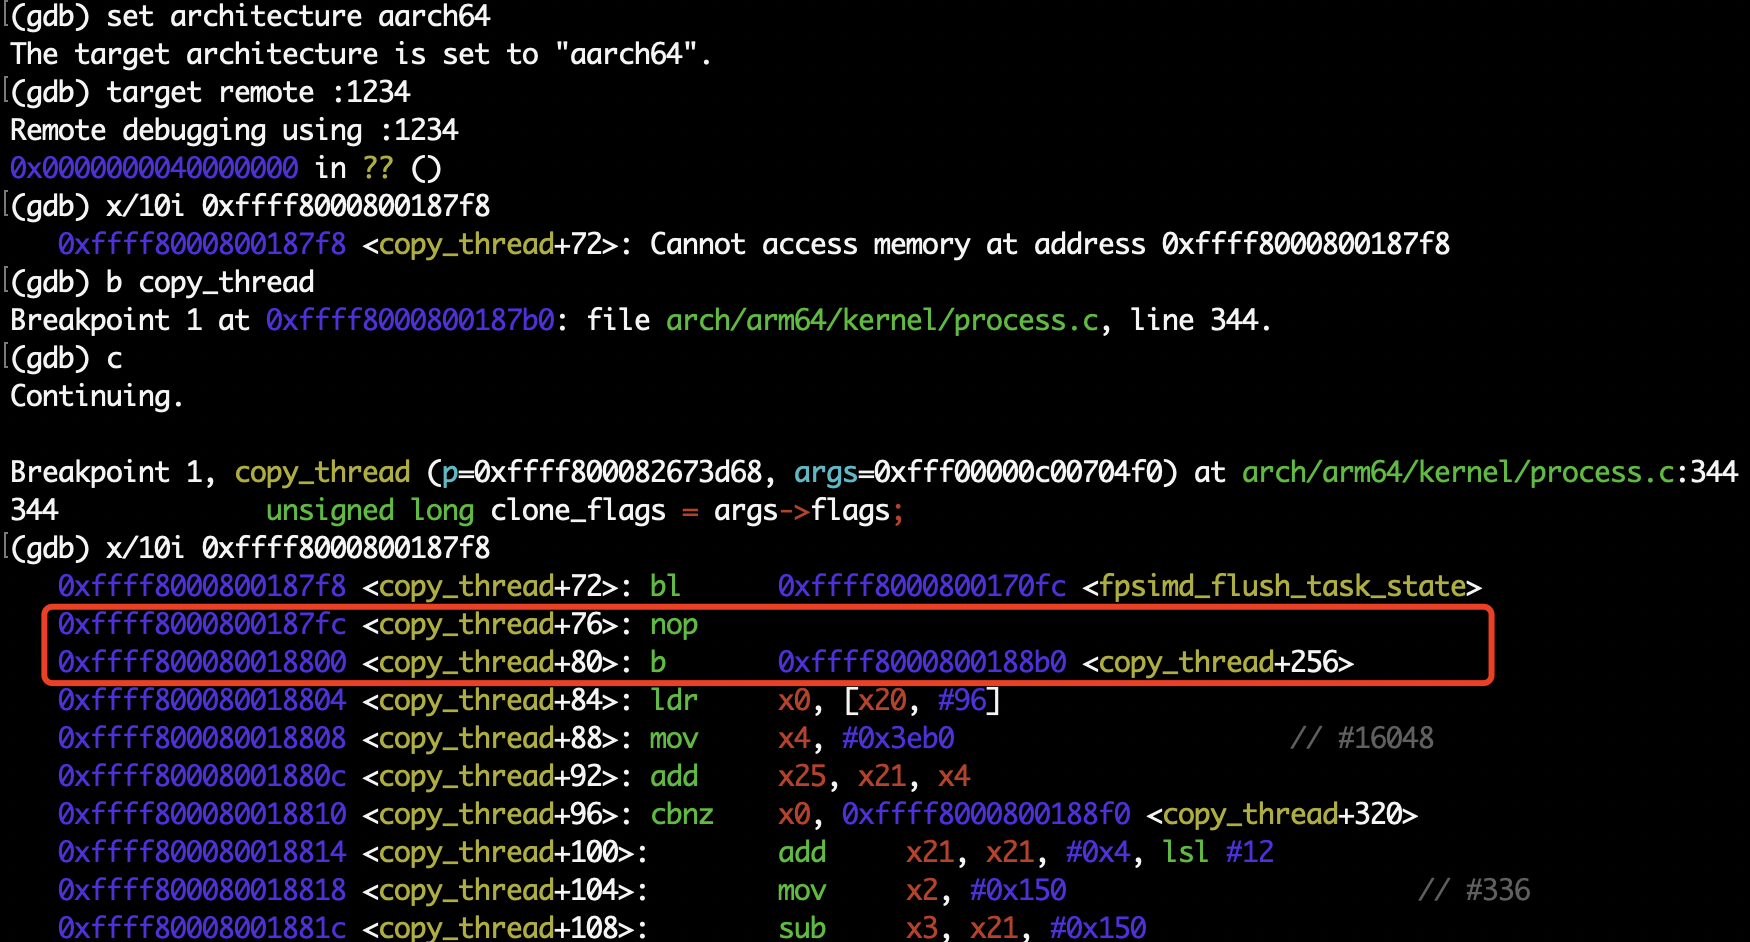
Turned out that the instructions truely got swapped during runtime.
Runtime Patching Analysis
There are many instances of instructions differing at runtime in a static kernel image.
Runtime code patching in the Linux kernel can occur due to three main mechanisms:
-
Alternatives (a.k.a. patch alternatives): A compile-time mechanism that can patch instructions at boot based on CPU features. It is applied once early during boot, not dynamically at runtime.
-
Static keys (a.k.a. jump labels): A dynamic runtime patching mechanism used to enable/disable code paths efficiently. Static keys modify code in place at runtime to enable fast conditional execution.
-
Live Patching: A mechanism that allows runtime replacement of functions or code in the kernel to fix bugs or security issues without rebooting the system.
1. Alternatives
There is a blog by Oracle that introduces Arm64 runtime patching alternatives. I primarily refer to this resource in the content below.
The Linux Alternatives Framework is a set of macros that kernel developers can use to prepare their code for boot time patching. It is available for multiple CPU architectures, including X86, ARM64, S390, and PA-RISC. The alternative macro stores the default original code in the .text 0 section and the replacement code in the .text 1 section.
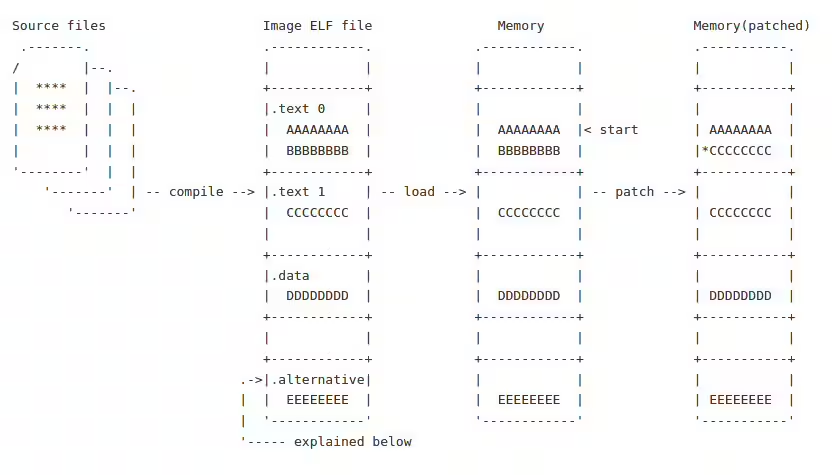
The macro also creates an alt_instr structure containing the offset locations, instruction length, and the CPU feature bit. The structure is stored in the .alternative section. At boot time, the Linux kernel will walk through the .alternative section and compare each alt_instr structure with the running CPU’s features. If the machine does not have the specific feature, the default code remains unchanged. Otherwise, the kernel will replace the default code with the replacement code using the information available in the alt_instr structure.
struct alt_instr {
    s32 orig_offset; /* offset to original instruction          */
    s32 alt_offset;  /* offset to replacement instruction       */
    u16 cpufeature;  /* cpufeature bit set for replacement      */
    u8 orig_len;     /* size of original instruction(s)         */
    u8 alt_len;      /* size of new instruction(s), <= orig_len */
};
For each code snippet that can have alternative, there is a pair of macros applied. An example is
SYM_FUNC_START(crc32_le)           /* start of the function                                    */
alternative_if_not ARM64_HAS_CRC32 /* assuming the runtime machine has no hardware CRC feature */
    b crc32_le_base                /* default branch to software CRC routine                   */
alternative_else_nop_endif         /* patch with nop if machine has hardware CRC feature       */
    __crc32                        /* a macro which uses hardware CRC instructions             */
SYM_FUNC_END(crc32_le)
Please see the Oracle blog for a detailed analysis of the example above, in which they expanded the macros and illustrated how the assembly code creates the alt_instr structure and stores the replacement code in a separate section.
The source code related to ARM64 runtime patching can be found in file linux/arch/arm64/kernel/alternative.c.
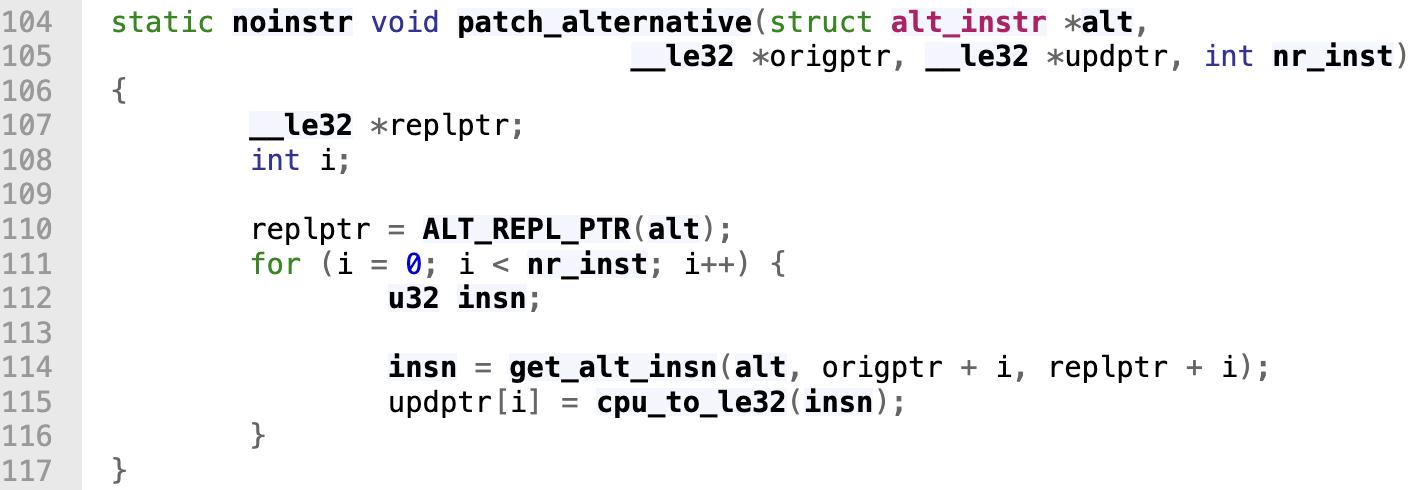
Specifically, the patch_alternative function (source code) appeared to be highly related:
To capture all the runtime memory changes done by patch alternatives, I set breakpoints at functions apply_boot_alternatives and apply_alternatives_all. At the breakpoints, I used gdb command to dump runtime memory as binaries, an example of dumping the .text section looks like:
(gdb) dump binary memory text.bin 0xffff800080010000 0xffff8000810d5000
Compare the memory dump before and after apply_boot_alternatives and apply_alternatives_all (meaning you need to dump four times in total) will give all the changes caused by patch alternatives.
The reason why one cannot simply observe the result memory after apply_alternatives_all for all changes related to patch alternatives is that there are changes to the .text section made in between the two patch alternative functions.
I also extracted the .text section from the vmlinux image I built. It turned out that four addresses were modified before apply_boot_alternatives was called, and the changes were actually applied even before __primary_switched. The four modified addresses appear as follows in the static kernel image.
ffff8000810c2e78 <__kvm_nvhe_$d>:
ffff8000810c2e78:	00000000 	udf	#0
ffff8000810c2e7c:	00000000 	udf	#0
ffff8000810c2e80:	00000000 	udf	#0
ffff8000810c2e84:	00000000 	udf	#0
It’s worth noticing that in the Oracle blog they used hbreak rather than break to set breakpoints.
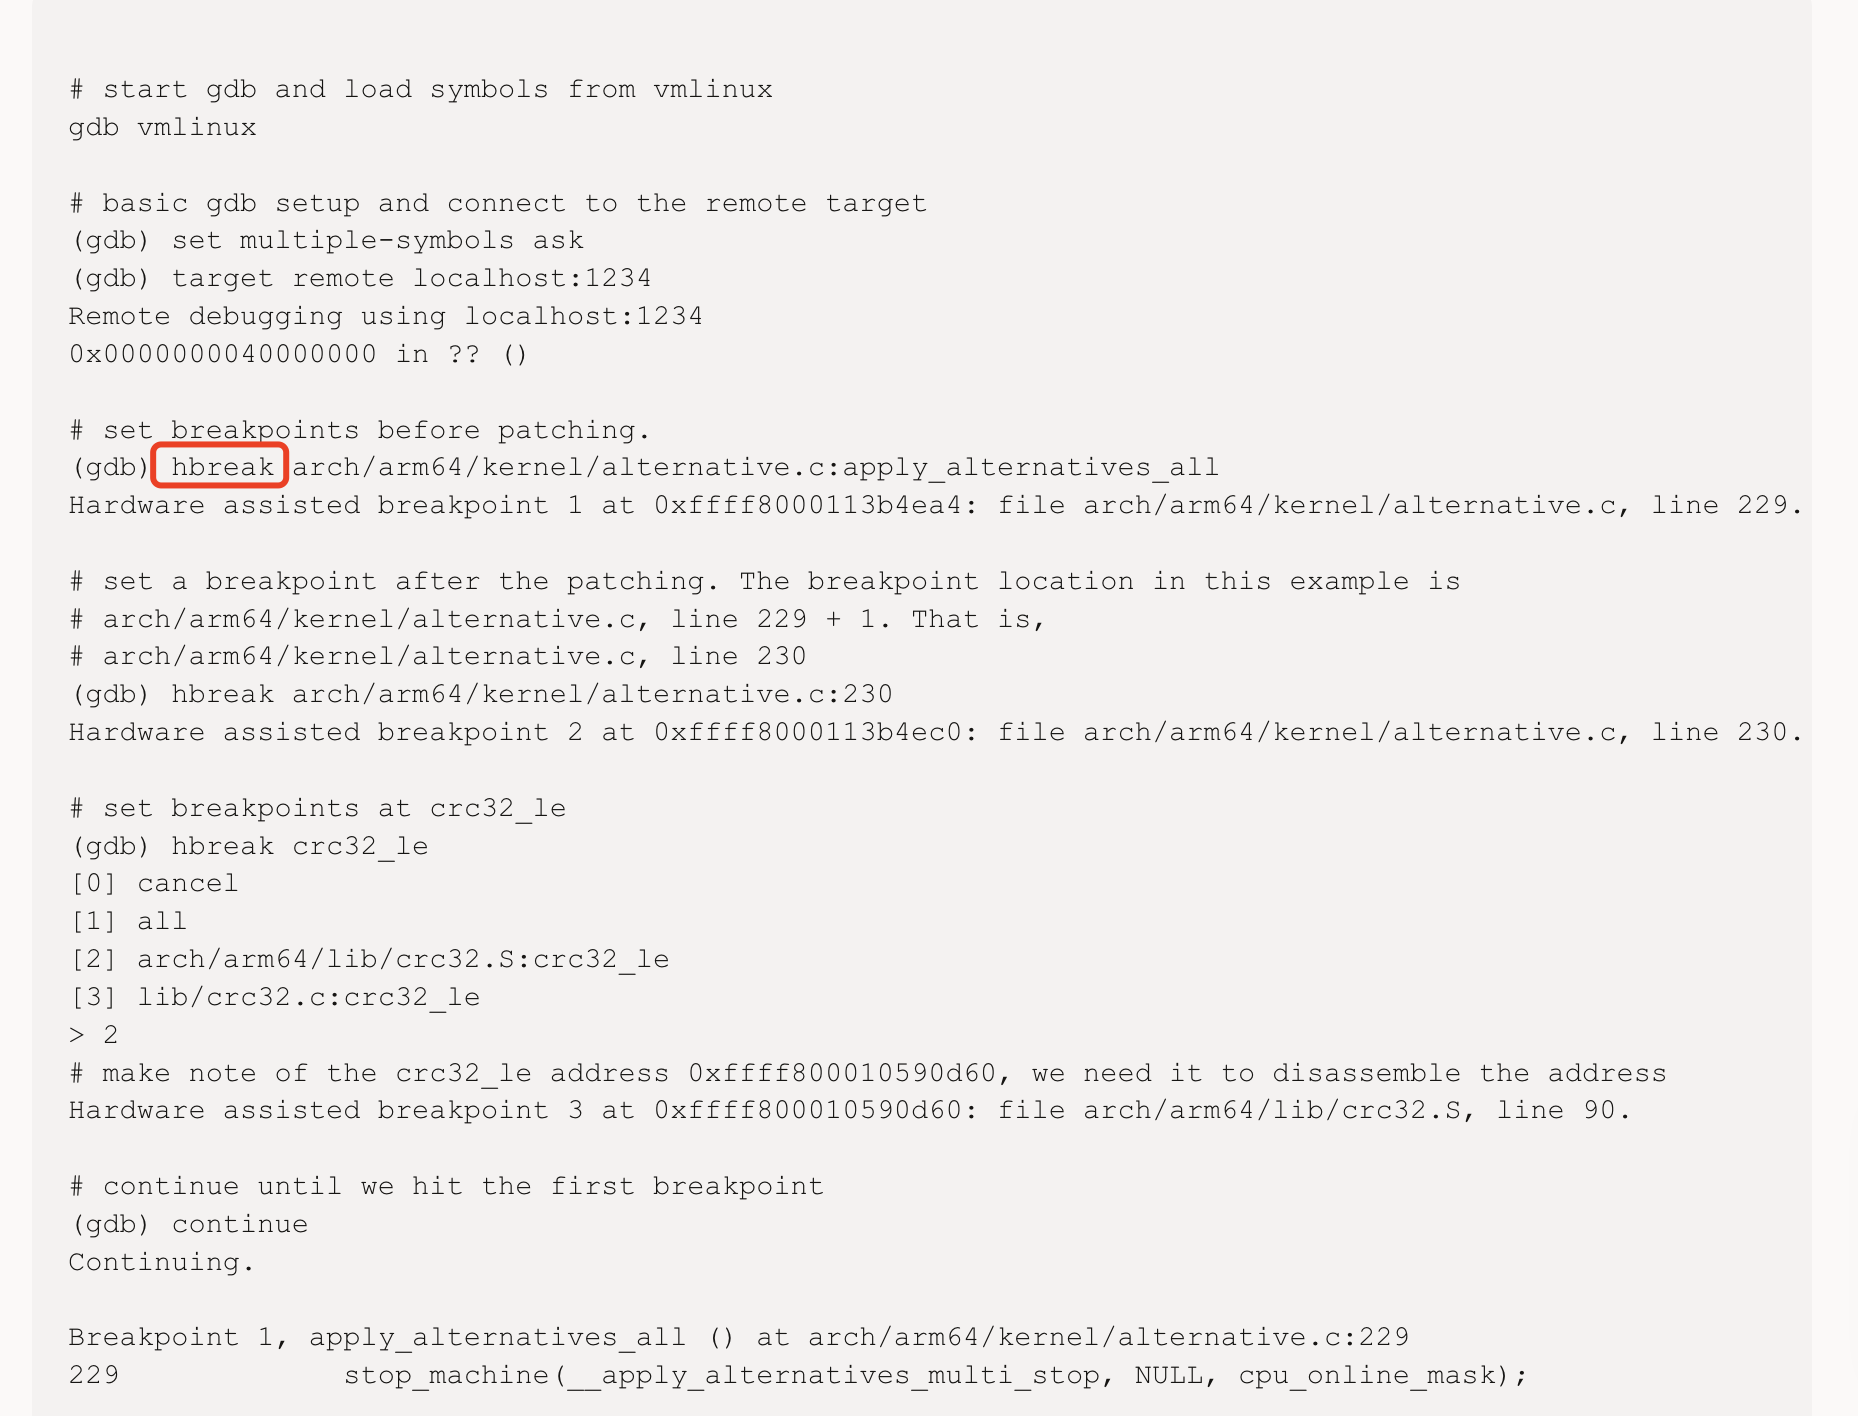
It turns out that the hbreak are hardware breakpoints that use the CPU’s hardware debug registers and should be used in:
- Debugging read-only memory (e.g., ROM or flash).
- Debugging code in shared libraries or other regions where inserting software breakpoints might be unsafe or unsupported.
- Debugging low-level system code (like kernels or embedded systems) where instruction modification isn’t possible or desirable. 👀
According to the QEMU document and my observation, it treats breakpoint as hardware breakpoints in TCG mode.
An important follow up question: Is there a way to fully disable patch alternatives? Sadly, according to what I found on the Internet, there is no configuration availble when building Linux kernel to disable ALL the patch alternatives.
2. Static Keys
Related documentation can be found at this link.
Static keys allows the inclusion of seldom used features in performance-sensitive fast-path kernel code, via a GCC feature and a code patching technique.
A quick example:
DEFINE_STATIC_KEY_FALSE(key);

...

if (static_branch_unlikely(&key))
    do unlikely code
else
    do likely code

...
static_branch_enable(&key);
...
static_branch_disable(&key);
...
The static_branch_unlikely() branch will be generated into the code with as little impact to the likely code path as possible.
I didn’t dive too deep into this topic since I found that setting CONFIG_JUMP_LABEL=n in the kernel configuration can fully disable these static keys.
3. Live Patching
Related documentation can be found at this link.
There are multiple mechanisms in the Linux kernel that are directly related to redirection of code execution; namely: kernel probes, function tracing, and livepatching:
- The kernel probes are the most generic. The code can be redirected by putting a breakpoint instruction instead of any instruction.
- The function tracer calls the code from a predefined location that is close to the function entry point. This location is generated by the compiler using the
-pggcc option. - Livepatching typically needs to redirect the code at the very beginning of the function entry before the function parameters or the stack are in any way modified.
All three approaches need to modify the existing code at runtime. Therefore they need to be aware of each other and not step over each other’s toes. Most of these problems are solved by using the dynamic ftrace framework as a base.
Runtime Patching Conclusion
After disabling Static Keys (a.k.a. jump label) with CONFIG_JUMP_LABEL=n in kernel compilation, the main contribution to runtime code modification in kernel .text section is the patch alternative mechanism.
With gdb and QEMU, I collected a simple boot-shutdown emulation of an arm64 Linux kernel, I dumped the runtime memory .text section at various breakpoints and compare them with the previous one, to collect the following statistics for future reference:
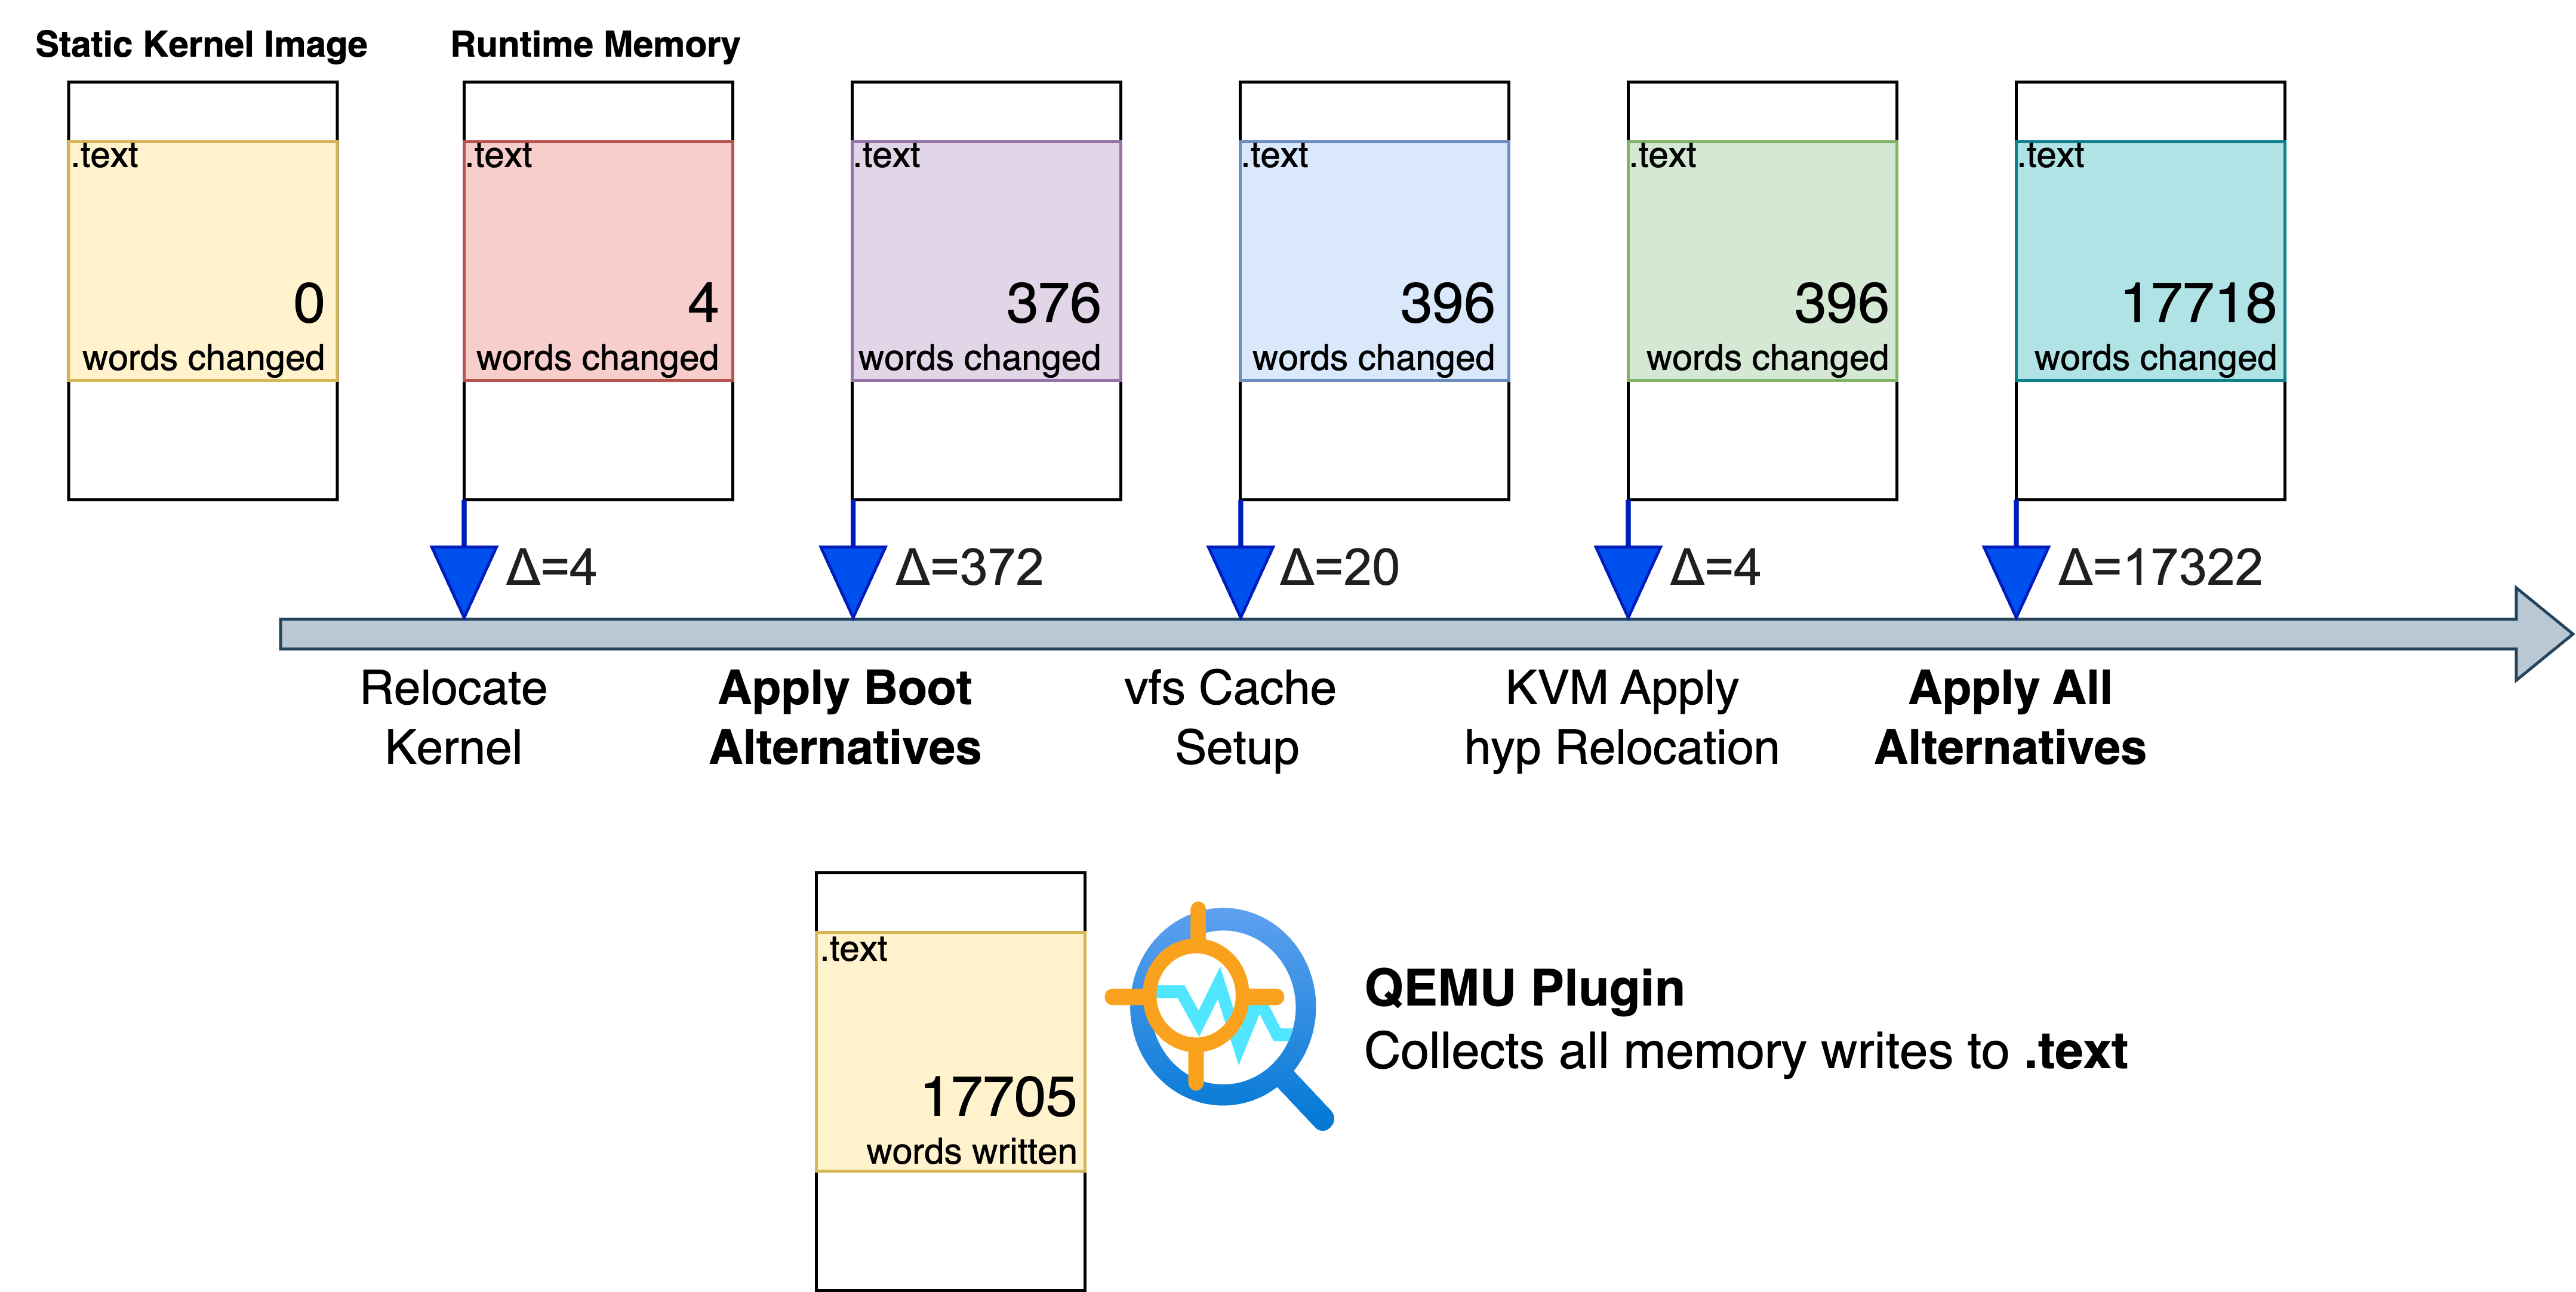
apply_boot_alternatives and apply_alternatives_all are two main sources of runtime code rewriting. Both are part of the Linux patch alternative framework.
See source code for the kvm_apply_hyp_relocations function. The function is responsible for relocating certain symbols used by the KVM hypervisor code (HYP mode) during the early initialization of KVM.
See source code for the vfs_caches_init_early function. The function is called early during the kernel boot process to prepare basic data structures used by the VFS. Further looking at the source code, I annotated the place where rewrite happens:
void __init vfs_caches_init_early(void)
{
	int i;

	for (i = 0; i < ARRAY_SIZE(in_lookup_hashtable); i++)
		INIT_HLIST_BL_HEAD(&in_lookup_hashtable[i]);

	dcache_init_early();            //   static void __init dcache_init_early(void)
                                    // 	{
                                    // 		/* If hashes are distributed across NUMA nodes, defer
                                    // 		* hash allocation until vmalloc space is available.
                                    // 		*/
                                    // 		if (hashdist)
                                    // 			return;

                                    // 		dentry_hashtable =
                                    // 			alloc_large_system_hash("Dentry cache",
                                    // 						sizeof(struct hlist_bl_head),
                                    // 						dhash_entries,
                                    // 						13,
                                    // 						HASH_EARLY | HASH_ZERO,
                                    // 						&d_hash_shift,
                                    // 						NULL,
                                    // 						0,
                                    // 						0);
                                    // 		d_hash_shift = 32 - d_hash_shift;

                                    // 		runtime_const_init(shift, d_hash_shift);       <- rewrite happens!
                                    // 		runtime_const_init(ptr, dentry_hashtable);     <- rewrite happens!
                                    // 	}
	inode_init_early();
}
Note that the “Relocate Kernel” breakpoint in the nice graph above is actually referring to relocate_kernel function, see source code. But in GDB you cannot simply set breakpoint at this function name, since this function is copied to a low kernel address when executed at the very early stage of booting. In the assembly this function is named as __pi_relocate_kernel, the suffix pi stands for position-independent, these functions are particularly in relation to the kernel KASLR (Kernel Address Space Layout Randomization) support on ARM64. With KASLR, the kernel is loaded at a randomized virtual address. To support this, some parts of the kernel code are built as position-independent, and internally, the kernel uses relocation and runtime fixups.
2025 Jun 25 Note: Simply disable KVM with CONFIG_KVM=n in kernel compilation can remove all the rewrites related to KVM (including both “Relocate Kernel” and “KVM Apply hyp Relocation”).
A Useful QEMU Plugin
When investigating the runtime patch behavior, I implemented a QEMU plugin called runtime_patch_monitor at my QEMU plugin fork. Please see this link for source code.
The plugin makes use of the qemu_plugin_register_vcpu_mem_cb to detect all instructions involving memory writes, and further filter by store instruciton and target address, and find all writes to the physical address range of .text section during QEMU emulation. The plugin dumps all the addresses together with the updated 32-bit data as binaries, and this dump can be later parsed to analyze all the runtime memory writes performed to the .text section.
To get the updated data I used qemu_plugin_read_memory_vaddr, this API function came in QEMU v10.0, so the plugin has to be used with at least this version of QEMU.
Two minor issues I observed when using this plugin:
- On very rare occasions, some memory rewrites are performed using instructions like
ldrsw x5, [x21, #16], which extend a 32-bit value into 64-bit. This means two addresses are rewritten, but the plugin only captures the lower address, since the write appears to affect only that one. - The plugin faithfully records all memory writes. However, a small number of them (fewer than 50 in my experiments) turned out to be writing the same content that was already there. These are benign false positives to keep in mind.
Aside from these two issues, the plugin worked extremely well in detecting runtime patches. I manually verified all the abnormal entries (about 40 in total) it generated against gdb runtime memory dumps, and concluded that the plugin is capable of capturing ALL RUNTIME CODE PATCHES.
A IDA Pro Plugin
See this link for a related IDA Pro plugin for analyzing patch alternatives in kernel image.